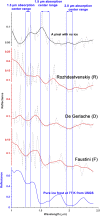
Direct evidence of surface exposed water ice in the lunar polar regions
- PMID: 30126996
- PMCID: PMC6130389
- DOI: 10.1073/pnas.1802345115
Direct evidence of surface exposed water ice in the lunar polar regions
Abstract
Water ice may be allowed to accumulate in permanently shaded regions on airless bodies in the inner solar system such as Mercury, the Moon, and Ceres [Watson K, et al. (1961) J Geophys Res 66:3033-3045]. Unlike Mercury and Ceres, direct evidence for water ice exposed at the lunar surface has remained elusive. We utilize indirect lighting in regions of permanent shadow to report the detection of diagnostic near-infrared absorption features of water ice in reflectance spectra acquired by the Moon Mineralogy Mapper [M (3)] instrument. Several thousand M (3) pixels (∼280 × 280 m) with signatures of water ice at the optical surface (depth of less than a few millimeters) are identified within 20° latitude of both poles, including locations where independent measurements have suggested that water ice may be present. Most ice locations detected in M (3) data also exhibit lunar orbiter laser altimeter reflectance values and Lyman Alpha Mapping Project instrument UV ratio values consistent with the presence of water ice and also exhibit annual maximum temperatures below 110 K. However, only ∼3.5% of cold traps exhibit ice exposures. Spectral modeling shows that some ice-bearing pixels may contain ∼30 wt % ice that is intimately mixed with dry regolith. The patchy distribution and low abundance of lunar surface-exposed water ice might be associated with the true polar wander and impact gardening. The observation of spectral features of H2O confirms that water ice is trapped and accumulates in permanently shadowed regions of the Moon, and in some locations, it is exposed at the modern optical surface.
Keywords: Moon mineralogy mapper; lunar polar regions; lunar water ice; near-infrared spectroscopy; permanently shaded regions.
Copyright © 2018 the Author(s). Published by PNAS.
Conflict of interest statement
The authors declare no conflict of interest.
Figures


Similar articles
-
Evidence for surface water ice in the lunar polar regions using reflectance measurements from the Lunar Orbiter Laser Altimeter and temperature measurements from the Diviner Lunar Radiometer Experiment.Icarus. 2017 Apr 2;Volume 292:74-85. doi: 10.1016/j.icarus.2017.03.023. Icarus. 2017. PMID: 32367891 Free PMC article.
-
Water on the surface of the Moon as seen by the Moon Mineralogy Mapper: Distribution, abundance, and origins.Sci Adv. 2017 Sep 13;3(9):e1701471. doi: 10.1126/sciadv.1701471. eCollection 2017 Sep. Sci Adv. 2017. PMID: 28924612 Free PMC article.
-
Hydrogen mapping of the lunar south pole using the LRO neutron detector experiment LEND.Science. 2010 Oct 22;330(6003):483-6. doi: 10.1126/science.1185696. Science. 2010. PMID: 20966247
-
The lunar dust environment: concerns for Moon-based astronomy.Philos Trans A Math Phys Eng Sci. 2024 May 9;382(2271):20230075. doi: 10.1098/rsta.2023.0075. Epub 2024 Mar 25. Philos Trans A Math Phys Eng Sci. 2024. PMID: 38522460 Free PMC article. Review.
-
Lunar lava tube radiation safety analysis.J Radiat Res. 2002 Dec;43 Suppl:S41-5. doi: 10.1269/jrr.43.s41. J Radiat Res. 2002. PMID: 12793728 Review.
Cited by
-
Multiple sources of water preserved in impact glasses from Chang'e-5 lunar soil.Sci Adv. 2024 May 10;10(19):eadl2413. doi: 10.1126/sciadv.adl2413. Epub 2024 May 10. Sci Adv. 2024. PMID: 38728402 Free PMC article.
-
Scientific objectives and payload configuration of the Chang'E-7 mission.Natl Sci Rev. 2023 Dec 29;11(2):nwad329. doi: 10.1093/nsr/nwad329. eCollection 2024 Feb. Natl Sci Rev. 2023. PMID: 38384740 Free PMC article. Review.
-
A novel method for extracting metals from asteroids using non-aqueous deep eutectic solvents.Sci Rep. 2023 Oct 8;13(1):16960. doi: 10.1038/s41598-023-44152-0. Sci Rep. 2023. PMID: 37807021 Free PMC article.
-
Sverdrup-Henson crater: A candidate location for the first lunar South Pole settlement.iScience. 2023 Sep 9;26(10):107853. doi: 10.1016/j.isci.2023.107853. eCollection 2023 Oct 20. iScience. 2023. PMID: 37752949 Free PMC article.
-
The Effects of Galactic Cosmic Rays on the Central Nervous System: From Negative to Unexpectedly Positive Effects That Astronauts May Encounter.Biology (Basel). 2023 Mar 3;12(3):400. doi: 10.3390/biology12030400. Biology (Basel). 2023. PMID: 36979092 Free PMC article. Review.
References
-
- Urey HC. The Planets: Their Origin and Development. Yale Univ Press; New Haven, CT: 1952.
-
- Arnold JR. Ice in the lunar polar regions. J Geophys Res. 1979;84:5659–5668.
-
- Watson K, Murray BC, Brown H. The behavior of volatiles on the lunar surface. J Geophys Res. 1961;66:3033–3045.
-
- Vasavada AR, Paige DA, Wood SE. Near-surface temperatures on mercury and the moon and the stability of polar ice deposits. Icarus. 1999;141:179–193.
-
- Salvail JR, Fanale FP. Near-surface ice on mercury and the moon–A topographic thermal-model. Icarus. 1994;111:441–455.
LinkOut - more resources
Full Text Sources
Other Literature Sources


