The Ketogenic Diet Alters the Hypoxic Response and Affects Expression of Proteins Associated with Angiogenesis, Invasive Potential and Vascular Permeability in a Mouse Glioma Model
- PMID: 26083629
- PMCID: PMC4470583
- DOI: 10.1371/journal.pone.0130357
The Ketogenic Diet Alters the Hypoxic Response and Affects Expression of Proteins Associated with Angiogenesis, Invasive Potential and Vascular Permeability in a Mouse Glioma Model
Abstract
Background: The successful treatment of malignant gliomas remains a challenge despite the current standard of care, which consists of surgery, radiation and temozolomide. Advances in the survival of brain cancer patients require the design of new therapeutic approaches that take advantage of common phenotypes such as the altered metabolism found in cancer cells. It has therefore been postulated that the high-fat, low-carbohydrate, adequate protein ketogenic diet (KD) may be useful in the treatment of brain tumors. We have demonstrated that the KD enhances survival and potentiates standard therapy in a mouse model of malignant glioma, yet the mechanisms are not fully understood.
Methods: To explore the effects of the KD on various aspects of tumor growth and progression, we used the immunocompetent, syngeneic GL261-Luc2 mouse model of malignant glioma.
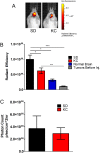
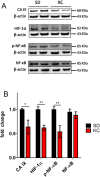
Results: Tumors from animals maintained on KD showed reduced expression of the hypoxia marker carbonic anhydrase 9, hypoxia inducible factor 1-alpha, and decreased activation of nuclear factor kappa B. Additionally, tumors from animals maintained on KD had reduced tumor microvasculature and decreased expression of vascular endothelial growth factor receptor 2, matrix metalloproteinase-2 and vimentin. Peritumoral edema was significantly reduced in animals fed the KD and protein analyses showed altered expression of zona occludens-1 and aquaporin-4.
Conclusions: The KD directly or indirectly alters the expression of several proteins involved in malignant progression and may be a useful tool for the treatment of gliomas.
Conflict of interest statement
Figures


Similar articles
-
Expression patterns of the hypoxia-related genes osteopontin, CA9, erythropoietin, VEGF and HIF-1alpha in human glioma in vitro and in vivo.Radiother Oncol. 2007 Jun;83(3):398-405. doi: 10.1016/j.radonc.2007.05.003. Epub 2007 May 23. Radiother Oncol. 2007. PMID: 17524506
-
Inhibition of hypoxia inducible factor-1alpha (HIF-1alpha) decreases vascular endothelial growth factor (VEGF) secretion and tumor growth in malignant gliomas.J Neurooncol. 2006 Jul;78(3):233-47. doi: 10.1007/s11060-005-9103-z. Epub 2006 Apr 13. J Neurooncol. 2006. PMID: 16612574
-
RNA interference targeting hypoxia-inducible factor 1α via a novel multifunctional surfactant attenuates glioma growth in an intracranial mouse model.J Neurosurg. 2015 Feb;122(2):331-41. doi: 10.3171/2014.10.JNS132363. Epub 2014 Nov 28. J Neurosurg. 2015. PMID: 25423275
-
Molecular events implicated in brain tumor angiogenesis and invasion.Pediatr Neurosurg. 2000 Jul;33(1):49-55. doi: 10.1159/000028975. Pediatr Neurosurg. 2000. PMID: 11025423 Review.
-
The ketogenic diet for the treatment of glioma: insights from genetic profiling.Epilepsy Res. 2012 Jul;100(3):327-37. doi: 10.1016/j.eplepsyres.2011.09.022. Epub 2011 Oct 22. Epilepsy Res. 2012. PMID: 22019313 Review.
Cited by
-
An Exogenous Ketone Ester Slows Tumor Progression in Murine Breast and Renal Cancer Models.Cancers (Basel). 2024 Oct 4;16(19):3390. doi: 10.3390/cancers16193390. Cancers (Basel). 2024. PMID: 39410010 Free PMC article.
-
Systematic Review and Clinical Insights: The Role of the Ketogenic Diet in Managing Glioblastoma in Cancer Neuroscience.J Pers Med. 2024 Aug 31;14(9):929. doi: 10.3390/jpm14090929. J Pers Med. 2024. PMID: 39338183 Free PMC article. Review.
-
Metabolic programming of organ-specific natural killer cell responses.Immunol Rev. 2024 May;323(1):8-18. doi: 10.1111/imr.13333. Epub 2024 Apr 17. Immunol Rev. 2024. PMID: 38628147 Review.
-
Review of dietary patterns and gastric cancer risk: epidemiology and biological evidence.Front Oncol. 2024 Feb 20;14:1333623. doi: 10.3389/fonc.2024.1333623. eCollection 2024. Front Oncol. 2024. PMID: 38444674 Free PMC article. Review.
-
Improved therapy for clear cell renal cell carcinoma: beta-hydroxybutyrate and quercetin target hypoxia-induced angiogenesis and multidrug resistance.Mol Biol Rep. 2024 Mar 2;51(1):379. doi: 10.1007/s11033-024-09355-2. Mol Biol Rep. 2024. PMID: 38429605
References
Publication types
MeSH terms
Substances
Grants and funding
LinkOut - more resources
Full Text Sources
Other Literature Sources


