Abstract
BACKGROUND
Fungicide residues on fruit may adversely affect yeast during cider fermentation, leading to sluggish or stuck fermentation or the production of hydrogen sulfide (H2S), which is an undesirable aroma compound. This phenomenon has been studied in grape fermentation but not in apple fermentation. Low nitrogen availability, which is characteristic of apples, may further exacerbate the effects of fungicides on yeast during fermentation. The present study explored the effects of three fungicides: elemental sulfur (S0) (known to result in increased H2S in wine); fenbuconazole (used in orchards but not vineyards); and fludioxonil (used in post‐harvest storage of apples).
RESULTS
Only S0 led to increased H2S production. Fenbuconazole (≥0.2 mg L−1) resulted in a decreased fermentation rate and increased residual sugar. An interactive effect of yeast assimilable nitrogen (YAN) concentration and fenbuconazole was observed such that increasing the YAN concentration alleviated the negative effects of fenbuconazole on fermentation kinetics.
CONCLUSION
Cidermakers should be aware that residual fenbuconazole (as low as 0.2 mg L−1) in apple juice may lead to stuck fermentation, especially when the YAN concentration is below 250 mg L−1. These results indicate that fermentation problems attributed to low YAN may be caused or exacerbated by additional factors such as fungicide residues, which have a greater impact on fermentation performance under low YAN conditions. © 2016 The Authors. Journal of The Science of Food and Agriculture published by John Wiley & Sons Ltd on behalf of Society of Chemical Industry.
Keywords: cider fermentation, apple fungicides, fermentation rate, hydrogen sulfide, fenbuconazole, fludioxonil
INTRODUCTION
Fungicide applications in orchards are essential for controlling diseases and thus ensuring sufficient fruit quality for cider production. However, fungicide residues can negatively impact yeast biology and therefore fermentation performance and subsequent cider quality. In the USA, unfermented apple juice is commonly referred to as ‘cider’; however, in the present study, as in the global cider industry, the term ‘cider’ refers to the alcoholic beverage resulting from the fermentation of apple juice. The cidermaking process may be especially prone to increased fungicide residues because of the use of fungicides as post‐harvest storage protectants, as well as the fact that, unlike grapes used in winemaking, apples used in cidermaking may be grown in the same orchard with multiple market destinations. These factors, combined with wide variation in practices for washing fruit prior to juicing, could contribute to the presence of residual fungicides in the fermenting juice.
Fungicide residues may contribute to adverse fermentation conditions and the occurrence of objectionable off‐aromas, including hydrogen sulfide (H2S). H2S is a common off‐aroma occurring during alcoholic fermentation that negatively affects the quality of finished ciders. The causes of H2S production during fermentation are numerous and have complex interactive effects that remain a topic of current research. Factors including yeast strain1, 2 and yeast assimilable nitrogen (YAN)3, 4, 5 concentration, as well as the composition, temperature and deficiencies of other yeast nutrients, such as biotin and pantothenic acid,6 have all been shown to contribute to overall H2S production in wine fermentation. Certain fungicides are also known to increase H2S production in wine fermentation and significantly impact wine flavor,7 although the impact of fungicide residues has not been thoroughly examined in cider fermentation. Similarly, insufficient YAN in the fermenting juice contributes to sluggish and/or stuck fermentations8, 9, 10 and reduced wine quality through the production of higher alcohols and thiols combined with a decreased production of desirable esters and long‐chain fatty acids.8 The interactive effects of YAN concentration and fungicide residue could reasonably be expected to significantly impact cider quality in much the same way as in grape‐based wine production.
Elemental sulfur (S0) can be used in orchards and is commonly used in those that are organically‐managed to limit powdery mildew incidence. The mode of action as a fungicide is not fully understood, although it is known that S0 acts as an electron receptor in fungal respiratory chains and stimulates respiratory activities.11 Sulfur is also likely related to oxidation of sulphydryl groups in important mitochondrial respiratory enzymes12. S0 residues can be toxic to predominant native yeast found on grapes;13 however, S0 is not toxic to strains of Saccharomyces cerevisiae even at concentrations of 200 mg L−1, which is a level far greater than the reported residual S0 concentrations in grapes or apples.14 Although non‐toxic to yeast at practical residual concentrations, extensive research has indicated that S0 residue can lead to substantial increases in H2S production during wine fermentation.15, 16, 17 In grape or apple juice fermentations, S0 can non‐enzymatically react with reducing compounds in the fermenting juice to form H2S.18 S0 residues at concentrations as low as 1 mg L−1 have been shown to increase H2S production during wine fermentation.19 It is common for residues on fruit and in juice to greatly exceed these concentrations. One study found that residue on Cabernet Sauvignon berries was 1.5 µg g−1 S0 (approximately 1.7 mg L−1 S0 in must) at harvest but exceeded 12 µg g−1 S0 (approximately 13.5 mg L−1 S0 in must) at 1 month after application on Pinot Noir berries.20 The lack of data concerning the persistence of residual S0 in orchard systems leads to increased risk of residual S0 in apple juice prior to fermentation, as well as subsequent formation of H2S during yeast metabolism, which can negatively impact cider quality.
The impact of other fungicide residues on yeast growth and metabolism and the resulting cider quality is not well understood. Fenbuconazole is a common fungicide that is used to prevent several plant diseases, including powdery mildew, leaf blotch and various rot diseases in both apple and grape production. Fenbuconazole is a sterol inhibitor, specifically a demethylation inhibitor that prevents the biosynthesis of ergosterol in fungal plasma membranes.21 Currently, there are no data available on residual fenbuconazole in apple or grape juice, nor in finished wines or ciders. In a US Department of Agriculture (USDA) survey, 2.3% of apple samples were found to have detectable levels of residual fenbuconazole ranging from 0.008 to 0.015 mg L−1.22 Fludioxonil is a broad‐spectrum fungicide used frequently in the post‐harvest storage of apples, and it operates by interfering with the signal transduction pathways of fungi.23 It has been found to inhibit spore germination in Botrytis cenera.24 Residues of fludioxonil have been cited to be as high as 0.15 mg L−1 in finished wines,25 although residues have not been quantified in grape juice, apple juice or ciders. The USDA found that 16.9% of apple samples contained measurable fludioxonil residues, which ranged from 0.025 to 1.0 mg L−1.22 Similarly, the impact of these fungicides on cider fermentation or finished cider or wine quality has not been studied extensively. García et al.26 found that residual fludioxonil in Airen grape must at concentrations as low as 1 mg L−1 significantly alters the volatile fraction of wine aromas, although other flavor impacts are unknown, including the impact on the production of H2S by yeast during fermentation.
The present study aimed to determine the impact of fungicide residues on fermentation kinetics and the production of H2S during apple cider fermentation. Laboratory scale fermentations were used to compare the effect of three fungicides [elemental sulfur (S0), fludioxonil and fenbuconazole] on fermentation kinetics and H2S production by two yeast strains commonly used in cider production.
MATERIALS AND METHODS
Apple juice
Commercially produced pasteurized apple juice was used to ensure the consistency of juice across samples and to best represent large‐scale cidermaking practices. The juice used was White House Fresh Pressed Natural Apple Juice (National Fruit Product Co., Winchester, VA, USA). Multiple bottles of the juice were combined into one homogenous lot then stored in 1‐L aliquots at −20 °C until use, and then thawed to 22 °C prior to yeast inoculation. The juice was measured to have 12.9 °Brix by refractometer, pH 3.7 and titratable acidity 3.4 g L−1 malic acid equivalent using standard methods,27 and 53 mg L−1 YAN. YAN was quantified using commercially available Megazyme (Wicklow, Ireland) kits for primary amino nitrogen (K‐PANOPA) and ammonium ion concentration (Ammonia‐Rapid).
Fungicide additions
S0 was obtained in the form of Microthiol Disperss fungicide (80% sulfur; Nufarm Australia Ltd, Victoria, Australia) and added at concentrations of 5 and 20 mg L−1 S0. Fludioxonil was obtained in the form of Scholar SC fungicide (20.4% fludioxonil; Syngenta Crop Protection LLC, Greensboro, NC, USA) and added at concentrations of 0.2 and 0.4 mg L−1 fludioxonil. Fenbuconazole was obtained in the form of Indar 2 F fungicide (23.5% fenbuconazole; Dow Agrosciences LLC, Indianapolis, IN, USA) and added at concentrations of 2.5 and 5.0 mg L−1 fenbuconazole. Commercially available juice with no fungicides added was used as a control. The final fungicide concentrations in juice were not confirmed through analysis of juice after fungicide addition, which is a limitation of the present study. Furthermore, the original juice (commercially available apple juice) was not screened for fungicide residue. The results of the present study should therefore be interpreted from the perspective that the reported concentrations of fungicides added represent an additional amount to any fungicide residue possibly present in the original juice. The USDA stated limits for fungicide residues in apple juice are 0.4 mg L−1 for fludioxonil and 5.0 mg L−1 for fenbuconazole, which were set as the maximum added concentrations studied in the present study. Interactive effects of YAN and fenbuconazole residues were examined by adding YAN to the apple juice at concentrations of 25 mg N L−1 in the form of Fermaid K (Scott Laboratories, Inc., Petaluma, CA, USA) for the control, and further supplementing base apple juice with 100 and 200 mg N L−1 using diammonium phosphate to 153 and 253 mg N L−1 for the medium and high YAN concentration treatments (Scott Laboratories, Inc.). Each treatment was then supplemented with fenbuconazole at concentrations of 0 (control), 0.2 and 0.4 mg L−1 each.
Fermentations
Experimental fermentations were carried out in triplicate with two yeast strains for each treatment. Prise de Mousse Saccharomyces bayanus EC1118 (Lallemand, Montreal, Canada) was selected to represent a low‐H2S producing strain and Montrachet S. cerevisiae UCD522 (Lallemand, Montreal, Canada) was selected to represent a high‐H2S producing strain. Juice was inoculated with 0.05 g of the active dry yeast rehydrated in 35 °C water for 20 min. Yeast nutrient was added in the form of Fermaid K (Scott Laboratories, Inc.) to all fermentations at concentrations of 25 mg L−1. This added an additional 25 mg L−1 nitrogen to the juice, bringing total juice YAN to 78 mg L−1 for the control because the endogenous 53 mg N L−1 in the apple juice was not sufficient to complete fermentation. Fermentations were carried out in accordance with the method described by Ugliano and Henschke28 for rapid determination of H2S formation during alcoholic fermentation. These were conducted in 250‐mL Erlenmeyer flasks fitted with a one‐hole rubber stopper to which a H2S detector tube was affixed (see below). Fermentations were not aerated but were stirred twice per day at 800 r.p.m. for 5 min to prevent yeast settling. Fermentations were carried out at 18 °C in triplicate. The fermentation rate was monitored by measuring the mass of the fermentation vessel as a proxy for CO2 evolution. Finished cider was analyzed to determine pH, titratable acidity, residual YAN and residual sugar. Residual sugar was analyzed using a d‐fructose/d‐glucose (K‐FRUGLU) enzymatic kit (Megazyme).
H2S detector tubes
The H2S detection and quantification method was as described by Ugliano and Henschke.28 Detector tubes were obtained from Komyo Kitagawa (Tokyo, Japan). Tubes were inserted into a one‐hole rubber stopper to obtain a gas‐tight seal. CO2 produced during fermentation carried H2S through the detector tube. H2S reacts with the lead acetate (Tube 120SB, 120SD) or silver nitrate (Tube 120SF) contained in the tube, creating a discolored band. The different tubes have different capacities for total H2S quantification, and were selected based on total H2S production in a given treatment as determined by preliminary experimentation. The length of the discolored band is proportional to the amount of purged H2S. Readings were taken twice daily to determine the H2S production rate. If, at any reading point, the tube appeared to be near saturation, the tube was replaced with a new tube. This method may have allowed a small amount of H2S gas to escape, although it was employed consistently across treatments in the present study.
Determination of fermentation rate, duration and H2S production rate
Maximum fermentation rate was determined by taking the slope of the fermentation curve during the exponential phase of yeast growth corresponding to the highest constant rate of CO2 production, as reported previously.29 Steeper slopes correspond to faster fermentation rate. Fermentations were determined to be complete when the CO2 production rate decreased to less than 0.2 g day−1. Fermentation duration is expressed as total hours starting from inoculation. Total H2S production was determined by calculating the sum of H2S production over the time course of fermentation. To determine the relative rate of H2S production over the time course of fermentation, the fermentation duration was divided into four quartiles of equal time. The percentage of H2S produced in each quartile out of the total H2S produced for a given fermentation was compared to determine whether there was a significant difference in the H2S production over the time course of fermentation across treatments.
Statistical analysis
Values were compared using a one‐way analysis of variance (ANOVA), with P < 0.05 being considered statistically significant, followed by parametric mean testing using Tukey's honestly significant difference (HSD) using Prism, version 6 (GraphPad, La Jolla, CA, USA). Analyses comparing the interaction between yeast strain/YAN concentration and fungicide residues were analyzed using a two‐way ANOVA, with P < 0.05 being considered statistically significant, and post‐hoc testing by Tukey's HSD.
RESULTS AND DISCUSSION
Fermentation kinetics
Elemental sulfur
Regardless of the concentration added, S0 did not affect the fermentation duration, rate, total CO2 production or residual sugar with yeast strain EC1118 (Table 1). At the concentration of 5 mg L−1, S0 had no effect on fermentation duration, fermentation rate or residual sugar with either yeast strain (Tables 1 and 2). The 5 mg L−1 S0 treatment resulted in decreased total CO2 production by UCD 522, although there was no effect in the fermentations with EC1118. The 20 mg L−1 S0 treatment using strain UCD 522 containing added S0 at 20 mg L−1 was longer in duration (P < 0.05) by 25 h on average, and also had a lower maximum fermentation rate (P < 0.05) and lower total CO2 production than the control, although this effect was not observed for yeast strain EC1118 at the same S0 concentration. The interaction effect of yeast strain and S0 was significant with regards to fermentation duration (P = 0.0002, data not shown). Fermentation duration is known to differ among yeast strains30 and the results of the present study show that effect of S0 on fermentation rate also differs across yeast strains. The significance of this interaction effect supports the need to employ at least two yeast strains in studies investigating the impact of juice chemistry on fermentation performance. This also emphasizes the importance of considering the yeast strain when applying research findings to cider production. The residual sugar concentration was not different for any S0 treatment or yeast strain. CO2 production is directly correlated with the fermentation rate because CO2 evolution occurs concomitantly with sugar consumption by yeast. The lack of a significant difference in residual sugar (RS) at the same time as significant differences in CO2 production being observed in the added S0 conditions for fermentations conducted by UCD522 is likely a result of the higher level of precision in measurements for CO2 production by mass compared to the RS measurement by enzymatic assay. Taken together, these results suggest that cidermakers should be aware that residual S0 above 20 mg L−1 in juice can result in a fermentation duration of up to 1 day longer at 18 °C, although this should not impact on residual sugar concentration in the finished cider. The fermentation curves showing CO2 production over the time course of fermentation in Fig. 2(A, B) further illustrate this conclusion. The observed impact of S0 on fermentation kinetics as a whole is consistent with previous research indicating that sulfur residue does not significantly impact fermentation kinetics of S. cerevisiae during fermentation.14
Table 1.
Fermentation rate, fermentation duration, total CO2 production and residual sugar for fermentations using yeast strain EC1118
| Experimental treatment | Fermentation rate (g CO2 h−1) | Fermentation duration (h) | Total CO2 production (g) | Residual sugar (g L−1) |
|---|---|---|---|---|
| Control | 0.073 ± 0.002 a | 259 ± 0 a | 9.88 ± 0.13 a | 0.05 ± 0.02 a |
| Sulfur, 5 | 0.071 ± 0.000 a | 259 ± 0 a | 9.63 ± 0.16 a | 0.02 ± 0.01 a |
| Sulfur, 20 | 0.072 ± 0.001 a | 256 ± 0 a | 9.74 ± 0.23 a | 0.03 ± 0.00 a |
| Control | 0.073 ± 0.002 a | 259 ± 0 a | 9.88 ± 0.13 a | 0.05 ± 0.02 a |
| Fludioxonil, 2.5 | 0.071 ± 0.003 a | 251 ± 0 a | 9.85 ± 0.26 a | 0.04 ± 0.02 a |
| Fludioxonil, 5.0 | 0.068 ± 0.006 a | 259 ± 0 a | 10.08 ± 0.34 a | 0.05 ± 0.03 a |
| Control | 0.073 ± 0.002 a | 259 ± 0 a | 9.88 ± 0.13 a | 0.05 ± 0.02 a |
| Fenbuconazole 0.2 | 0.063 ± 0.003 b | 306 ± 24 b | 9.36 ± 0.05 b | 3.32 ± 2.92 a |
| Fenbuconazole, 0.4 | 0.059 ± 0.000 b | 314 ± 13 b | 9.12 ± 0.21 b | 9.26 ± 0.98 b |
Values expressed as the mean ± SD.
Values marked with different lowercase letters are significantly different from the control within a specified fungicide treatment (ANOVA with Tukey's HSD).
Fungicide concentrations are expressed as mg L−1.
Table 2.
Fermentation rate, fermentation duration, total CO2 production and residual sugar for fermentations using yeast strain UCD522
| Experimental treatment | Fermentation rate (g CO2 h−1) | Fermentation duration (h) | Total CO2 production (g) | Residual sugar (g L−1) |
|---|---|---|---|---|
| Control | 0.071 ± 0.001 a | 259 ± 0 a | 9.90 ± 0.09 a | 0.07 ± 0.01 a |
| Sulfur, 5 | 0.070 ± 0.001 a | 258 ± 10 a | 9.63 ± 0.03 b | 0.40 ± 0.07 a |
| Sulfur, 20 | 0.067 ± 0.002 b | 284 ± 0 b | 9.60 ± 0.14 b | 0.06 ± 0.00 a |
| Control | 0.071 ± 0.001 a | 259 ± 0 a | 9.90 ± 0.09 a | 0.07 ± 0.01 a |
| Fludioxonil, 2.5 | 0.074 ± 0.002 ab | 259 ± 0 a | 9.76 ± 0.15 a | 0.10 ± 0.02 a |
| Fludioxonil, 5.0 | 0.075 ± 0.002 b | 259 ± 0 a | 9.87 ± 0.14 a | 0.07 ± 0.02 a |
| Control | 0.071 ± 0.001 a | 259 ± 0 a | 9.90 ± 0.09 a | 0.07 ± 0.01 a |
| Fenbuconazole, 0.2 | 0.065 ± 0.001 b | 318 ± 9 b | 9.94 ± 0.13 a | 2.40 ± 1.19 b |
| Fenbuconazole, 0.4 | 0.061 ± 0.001 c | 322 ± 13 b | 9.41 ± 0.06 b | 7.72 ± 0.99 c |
Values expressed as the mean ± SD.
Values marked with different lowercase letters are significantly different from the control within a specified fungicide treatment (ANOVA with Tukey's HSD).
Fungicide concentrations are expressed as mg L−1.
Figure 2.
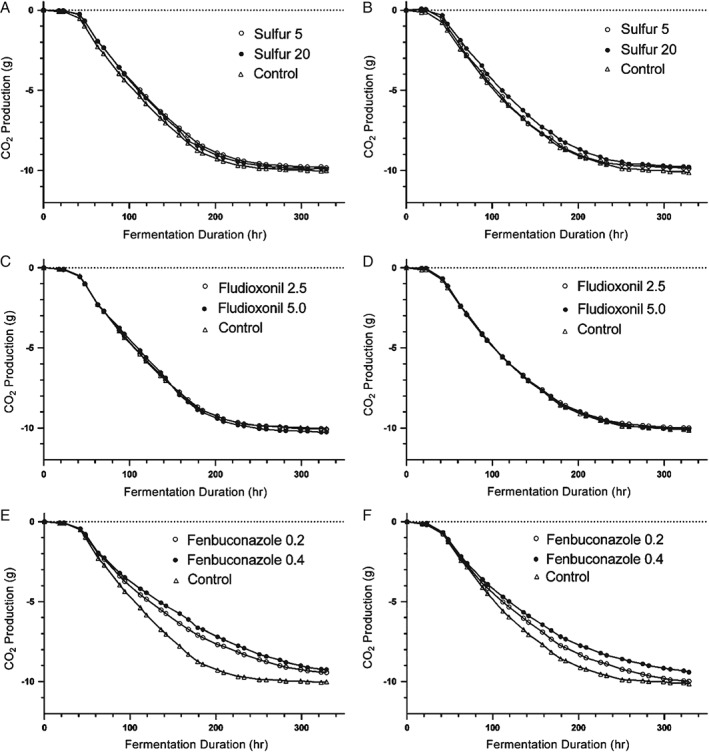
Fermentation curves for treatments containing the addition of fungicides plotted as change in the mass of the fermentation vessel as a result of CO2 purged from the fermenter over the time course of fermentation. The slope of the curve during the logarithmic phase of growth was used to calculate and compare maximum fermentation rates. (A), (C) and (E) Fermentations conducted by yeast strain EC1118. (B), (D) and (F) Fermentations conducted by yeast strain UCD522. Fungicide concentrations are expressed as mg L−1. Control fermentations contained no added fungicides.
Fludioxonil
The addition of fludioxonil did not significantly impact fermentation rate or duration in either yeast strain, with one exception. The 5 mg L−1 addition of fludioxonil slightly but significantly increased fermentation rate in the strain UCD522 (Table 2). No difference in CO2 production or RS was observed for either yeast strain in fermentations containing added fludioxonil (Table 2). Fludioxonil did not impact the time course of CO2 production in either yeast strain (Fig. 2C, D). Taken together from a practical perspective, these results suggest that fludioxonil does not significantly impact fermentation kinetics for EC1118 or UCD522.
Fenbuconazole
The addition of fenbuconazole increased fermentation duration (P < 0.05) and decreased fermentation rate (P < 0.01) in both yeast strains (Figures 1E, F and Tables 1 and 2). The addition of fenbuconazole at concentrations of 0.2 mg L−1 decreased the fermentation rate by approximately 10% on average in both strains. The fermentation rate decreased by 15% on average when fenbuconazole was added at concentrations of 0.4 mg L−1. Consequently, this increased fermentation duration in both strains at all concentrations (P < 0.05). On average, the addition of fenbuconazole increased fermentation duration by approximately 55 h regardless of yeast strain or concentration.
Figure 1.
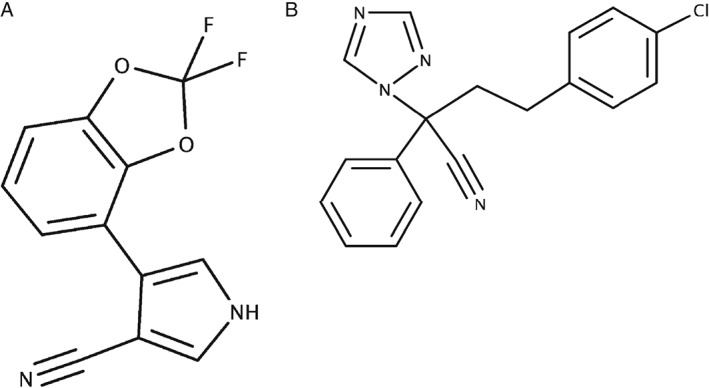
Chemical structures of (A) fludioxonil and (B) fenbuconazole.
The addition of fenbuconazole decreased the amount of CO2 produced during fermentation for both yeast strains, with the exception of the addition of 0.2 mg L−1 in the strain UCD522 (P < 0.05). Similarly, the addition of fenbuconazole increased RS concentration in all fermentations with the exception of the addition of 0.2 mg L−1 in the strain EC1118 (P < 0.05). Indeed, RS concentrations were 34‐ to 185‐fold higher on average in all fermentations containing added fenbuconazole (Tables 1 and 2). Fermentations supplemented with fenbuconazole at a concentration of 0.4 mg L−1 averaged 8.6 g L−1 RS. This concentration is too high for the finished cider to be considered ‘dry’; therefore, these fermentations are considered incomplete or ‘stuck’, which is a term commonly used to describe incomplete fermentation in wine production. Even with cider styles where residual sugar is acceptable, stuck fermentation is not desirable because the outcome is unpredictable. Stopping the fermentation by chilling to stop yeast metabolism or centrifuging to remove yeast provides a more reliable means of producing cider that contains residual sugar. The addition of fenbuconazole at increasing concentrations shows linear correlations with fermentation rate, fermentation duration, CO2 evolution and residual sugar (Fig. 3). Increasing the fenbuconazole concentration resulted in a decreased fermentation rate, increased fermentation duration, decreased total CO2 evolved and increased residual sugar (P < 0.001). As such, the results of the present study indicate that residual fenbuconazole at 0.2 and 0.4 mg L−1 can adversely affect cider fermentation and the resulting cider quality.
Figure 3.
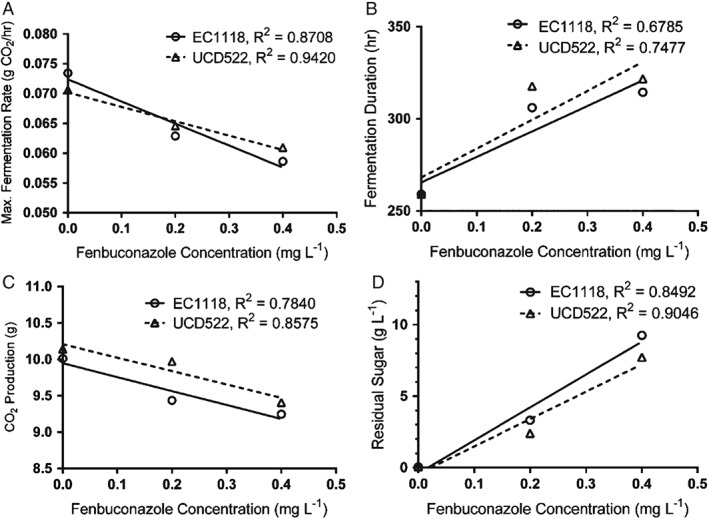
Linear regression of the maximum fermentation rate (A), fermentation duration (B), CO2 evolved (C) and residual sugar (D) for treatments with increasing fenbuconazole concentrations. Concentrations of fenbuconazole are expressed as mg L−1. All linear correlations were statistically significant (P < 0.01).
The mechanism by which fenbuconazole impacts yeast growth and metabolism was not determined in the present study. However, the decreasing fermentation rate with an increasing concentration of fenbuconazole suggests that fenbuconazole may either lower cell viability, yeast cell biomass or yeast growth rate. The fungicide mode of action of fenbuconazole is through the inhibition of ergosterol production.31 Ergosterol is an essential cell membrane constituent in fungi and, if the enzymes that generate ergosterol are disrupted, cellular death may result.32 In practice, residual fenbuconazole in apple juice merits consideration as a possible cause of sluggish cider fermentation.
Total H2S production
Elemental sulfur
The addition of S0 to juice led to an increase in H2S production (Fig. 4). For yeast strain EC1118, H2S production increased nine‐fold on average when added at 5 mg L−1 S0 and 20‐fold on average when added at 20 mg L−1 S0. Similarly, for UCD 522, H2S production increased almost five‐fold on average when added at 5 mg L−1 and increased almost 30‐fold on average when added at 20 mg L−1. These results are in agreement with previous findings that have identified residual S0 as a significant contributor to H2S production.15, 16, 17 In white wine production, the practice of settling the juice prior to beginning fermentation has been shown to minimize the negative impacts associated with high concentrations of S0 in the fermenting medium.33 Pre‐fermentation juice settling is not a standard practice in cider production and cidermakers could potentially encounter higher residual S0 in juice that can increase H2S production. The concentration of residual S0 present on apples prior to processing and fermentations has not been assessed in the present study or by previous research. It is possible that orchards using S0 as a fungicide may encounter higher residual concentrations of S0 in juice compared to the residual concentrations found in grape juice or must prior to fermentation. All of these factors indicate that assessment of residual S0 on apples and the implementation of practices to prevent or limit residual S0 concentrations in apple juice pre‐fermentation is important in cider production.
Figure 4.
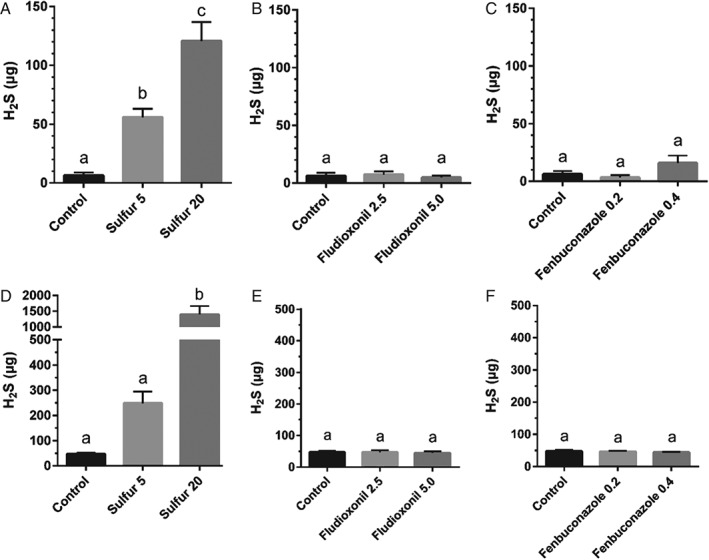
Total H2S produced during fermentations comparing treatments with fungicides at increasing concentrations. Values are expressed as the mean ± SD. Concentrations are expressed as µg H2S. Control fermentations contain no added fungicides. (A), (B) and (C) Fermentations using yeast strain EC1118. (D), (E) and (F) Fermentations using yeast strain UCD522. The y‐axis scales are not consistent because they reflect the maximum range of H2S produced within each yeast strain. Means not labeled with the same lowercase letter within specified yeast strain are significantly different (one‐way analysis of variance with Tukey's honestly significant difference, P < 0.05).
Fludioxonil
The addition of fludioxonil did not result in increased H2S production for either yeast strain (Fig. 4). This finding is complementary to the findings on fermentation rate and duration, indicating that residual fludioxonil does not adversely affect yeast growth or metabolism in cider fermentation.
Fenbuconazole
The addition of fenbuconazole did not lead to increased H2S production (Fig. 4), although fenbuconazole did significantly impact fermentation kinetics (Fig. 2 and Tables 1 and 2). Yeast produce H2S through the sulfur reduction sequence (SRS).34 In this process, sulfate ions are converted to free sulfur (S2−), which is then used in yeast metabolism to produce sulfur‐containing amino acids such as methionine and cysteine.34 It is likely that fenbuconazole, at the concentrations tested in the present study, did not interfere with SRS signal transduction, and hence did not affect H2S production by yeast, even if it did impact cell growth and/or viability.
Relative rate of H2S production
The time course of H2S production during fermentation may vary because H2S can be effectively stripped from the fermenting media by CO2 gas evolved during fermentation,35 especially during the period of maximum fermentation rate when CO2 evolution is also at its maximum rate. It is possible that a cider in which less total H2S had been produced but was subsequently produced later in the time course of fermentation could retain more of the unwanted H2S character in the final product. This could impart a greater sensory impact on the finished product. The addition of S0, especially at high concentrations, tended to alter the rate of H2S production (Fig. 5A, D). The percentage of the total production of H2S for a given treatment was greater in the third and fourth quartiles at all concentrations of S0 in the strain UCD522 (P < 0.05) compared to the control. At concentrations of 20 mg L−1, H2S production was greater in the third quartile in the strain EC1118 (P < 0.01). The greatest proportion of the total H2S was produced in the second quartile for the majority of fermentations. This correlates with the logarithmic phase of fermentation, which also corresponds to the highest rate of SRS activity in the yeast, leading to the observable spike in H2S production during the highest rate of fermentation.36 When S0 is present in the fermenting juice, however, H2S is produced throughout the duration of the fermentation because SRS activity is not the primary cause of H2S production.37 The addition of fludioxonil did not affect the rate of H2S production (Fig. 5B, E). H2S production decreased in the second quartile when fenbuconazole was added at 0.2 mg L−1 in both yeast strains (P < 0.05) (Figs 4C, F). However, higher concentrations of fenbuconazole did not significantly impact total H2S production. It is possible that yeast cell density is correlated with a change in the relative rate of H2S production and that fenbuconazole may decrease total cell biomass achieved during fermentation. The mechanism by which fenbuconazole affects H2S production may be determined in future studies by monitoring cell density throughout the time course of fermentation and corresponding H2S production.
Figure 5.
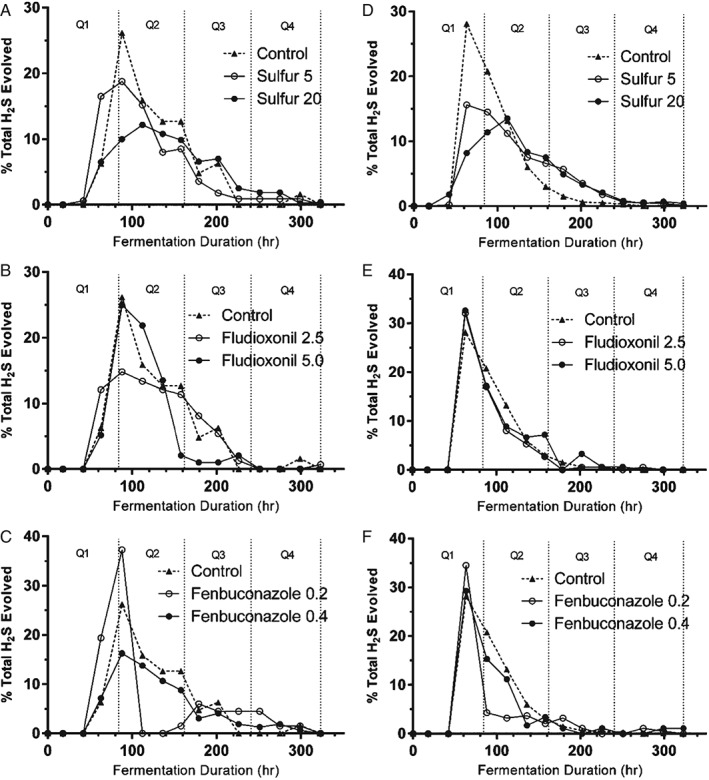
The percentage of the total H2S produced over the time course of fermentation. (A), (B) and (C) Ciders fermented using yeast strain EC1118. (D), (E) and (F) Ciders fermented using yeast strain UCD522. Q1–Q4 represent quartiles of the fermentation duration used to compare the rate of H2S evolution over the time course of fermentation.
Interactive effect of fenbuconazole and YAN
The fermentation kinetics results of the present study clearly illustrate that residual fenbuconazole can lead to sluggish and stuck cider fermentations. Insufficient YAN is also widely known to result in stuck and sluggish fermentations.9 The generally accepted minimum recommended concentration of YAN to successfully complete fermentation is 140 mg L−1 for wine.38 However, this recommendation is not universally accepted. The optimal concentration of pre‐fermentation YAN required for a given fermentation is difficult to determine as a result of interactions with numerous factors including but not limited to yeast strain,1, 2 micronutrient concentrations,6 biotin concentration,6 pantothenic acid concentration6 and temperature.6 The apple juice used in the present study contained an initial YAN concentration of 53 mg L−1 and was supplemented to 78 mg L−1 in all of the treatments. This relatively low YAN concentration is typical of apple juice.39 However, this concentration may still be insufficient to prevent sluggish or stuck fermentations and may have influenced the initial findings of the present study with respect to the impact of fenbuconazole on fermentation rate and duration.
The interactive effect of YAN and fenbuconazole on fermentations kinetics was investigated in fermentations conducted using yeast strain EC1118. One yeast strain and fungicide combination was selected to carry forward, with the experimental treatment now comprising an added residual fungicide concentration, YAN concentration, and the interaction of those two factors. The fermentation rate increased and fermentation duration decreased with an increasing YAN concentration (P < 0.05) (Fig. 6). This is in agreement with prior findings indicating that increasing YAN is correlated with increasing fermentation rate and decreasing fermentation duration.8 RS decreases with increasing YAN when fenbuconazole was present in concentrations of 0.4 mg L−1 (Fig. 7D), although RS was not significantly affected by increasing YAN for the control (no fenbuconazole) or at 0.2 mg L−1 fenbuconazole. This corroborates previous research indicating that increasing YAN minimizes sluggish or stuck fermentations,8, 9, 10 although the findings of the present study emphasize the influence of interactive effect of YAN with other parameters.
Figure 6.
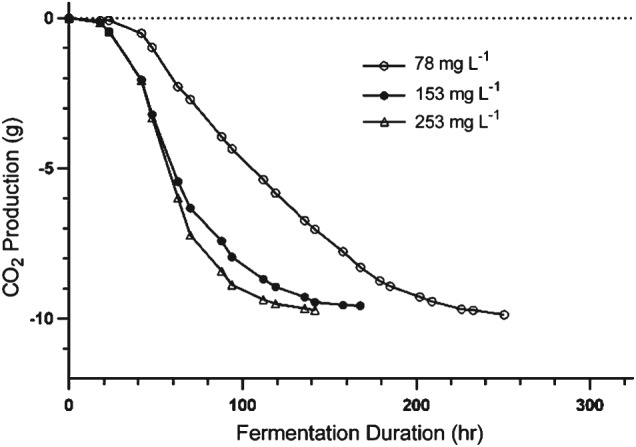
Fermentation curve for yeast strain EC1118 in apple juice containing different initial concentrations of YAN plotted as the mass of CO2 purged from the fermenter over the time course of fermentation. The slope of the curve during the logarithmic phase of growth was used to calculate and compare maximum fermentation rates. The fermentation rate increased significantly and fermentation duration decreased significantly with an increasing YAN concentration (one‐way analysis of variance with Tukey's honestly significant difference, P < 0.05).
Figure 7.
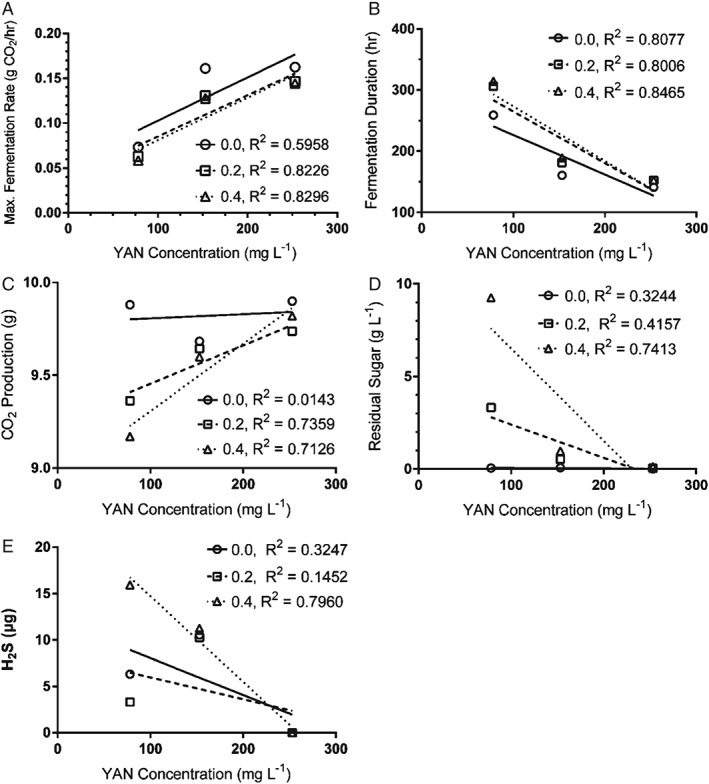
Linear regression of fermentation rate, fermentation duration, CO2 evolved, residual sugar and H2S production in fermentations treated with fenbuconazole and different concentrations of YAN. Concentrations of fenbuconazole are expressed as mg L−1. Linearity is significant for the fermentation rate at all concentrations (P < 0.05), fermentation duration at all concentrations (P < 0.01), CO2 evolution for concentrations of 0.2 and 0.4 mg L−1 (P < 0.01), residual sugar for concentrations of 0.4 mg L−1 (P < 0.01) and H2S production for concentrations of 0.4 mg L−1 (P < 0.01). There was a significant interaction between the addition of fenbuconazole and YAN for residual sugar (P = 0.0006) and H2S production (P = 0.0109).
There was an interactive effect between the addition of fenbuconazole and YAN on H2S production (P < 0.0001) (Fig. 7E). Increasing the YAN from 153 to 253 mg L−1 decreased H2S production in all fermentations (P < 0.001) (Fig. 8). There was no detectable H2S when the YAN concentration was 253 mg L−1. H2S production decreases with an increasing YAN concentration at 0.4 mg L−1 fenbuconazole (Fig. 8), with both factors significantly correlating (P = 0.0012) (Fig. 7E). This corroborates previous findings indicating that insufficient YAN supplementation can lead to increased H2S production.2 The results of the present study show that a minimum YAN concentration of 140 mg L−1 does not always prevent the occurrence of stuck or sluggish fermentations. Furthermore, a minimum YAN concentration of 140 mg L−1 does not always prevent the formation of H2S during fermentation, even with the relatively low starting sugar concentration of apple juice (compared to grape juice, comprising the media in which most YAN investigations have been conducted).
Figure 8.
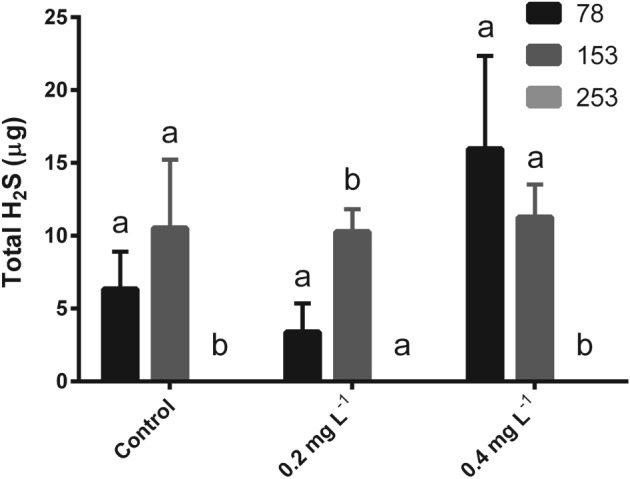
Total H2S produced during fermentations using yeast strain EC1118 comparing the interactive effects of total YAN and concentration of added fenbuconazole. Columns are grouped corresponding to the fenbuconazole concentration expressed as mg L−1. Values are expressed as the mean ± SD. Control juice contained no added fenbuconazole. Means not labeled with the same lowercase letter are significantly different within the specified fenbuconazole concentration (two‐way analysis of variance with Tukey's honestly significant difference, P < 0.05).
The addition of both 0.2 and 0.4 mg L−1 fenbuconazole lowered the fermentation rate in juice at both 78 and 153 mg L−1 YAN (P < 0.05) (Table 3). However, there was no difference in fermentation rate for any concentration of fenbuconazole at 253 mg L−1 YAN. At YAN concentrations of 153 mg L−1, fermentations with added fenbuconazole at both concentrations demonstrated a slower fermentation rate than the control with no fenbuconazole (P < 0.01). However, fermentation duration was not different among fenbuconazole concentrations when the YAN concentration was 253 mg L−1. The interaction of YAN and fenbuconazole concentration was not significant in terms of fermentation rate or duration (Fig. 7A, B). With all other variables held constant, increasing YAN concentrations correlate with an increase in yeast biomass.40 It is possible that residual fenbuconazole inhibited yeast growth and promoted yeast mortality. One possible explanation for the results of the present study is that increasing the YAN concentration may overcome this effect by allowing yeast biomass to increase to the point where the impact of residual fenbuconazole on yeast cell populations becomes negligible. Interestingly, fenbuconazole still adversely impacted fermentation kinetics when the YAN concentration was 153 mg L−1, which is higher the minimum concentration 140 mg L−1 typically considered sufficient to complete fermentations in wine and cider. Therefore, the minimum YAN concentration required for fermentation is greater than the standard recommendation when fenbuconazole is present in the juice.
Table 3.
Fermentation rate, fermentation duration, total CO2 production and residual sugar for interactive fermentations of fenbuconazole and YAN
| YAN | Fenbuconazole concentration | Fermentation rate (g CO2 h−1) | Fermentation duration (h) | Total CO2 production (g) | Residual sugar (g L−1) |
|---|---|---|---|---|---|
| 0.0 | 0.071 ± 0.001 a | 259 ± 0 a | 9.90 ± 0.09 a | 0.07 ± 0.01 a | |
| 78 | 0.2 | 0.065 ± 0.001 b | 318 ± 9 b | 9.94 ± 0.13 a | 2.40 ± 1.19 b |
| 0.4 | 0.061 ± 0.001 c | 322 ± 13 b | 9.41 ± 0.06 b | 7.72 ± 0.99 c | |
| 0.0 | 0.141 ± 0.000 a | 160 ± 4 a | 9.69 ± 0.12 a | 0.07 ± 0.03 a | |
| 153 | 0.2 | 0.131 ± 0.003 ab | 181 ± 0 b | 9.64 ± 0.10 a | 0.53 ± 0.15 b |
| 0.4 | 0.128 ± 0.003 b | 189 ± 0 b | 9.63 ± 0.13 a | 0.97 ± 0.27 c | |
| 0.0 | 0.163 ± 0.001 a | 141 ± 0 a | 9.90 ± 0.12 a | 0.01 ± 0.00 a | |
| 253 | 0.2 | 0.146 ± 0.004 a | 152 ± 10 a | 9.74 ± 0.09 a | 0.05 ± 0.02 a |
| 0.4 | 0.144 ± 0.005 a | 152 ± 10 a | 9.82 ± 0.05 a | 0.13 ± 0.01 a |
Values expressed as the mean ± SD.
Values marked with different lowercase letters are significantly different from the control within a specified fungicide treatment (ANOVA with Tukey's HSD).
Fungicide concentrations are expressed as mg L−1.
The RS concentration increased with increasing concentrations of fenbuconazole at YAN concentrations of 78 mg L−1 and 153 mg L−1 (Table 3). However, with a concentration of 153 mg L−1 YAN, the RS concentration was ten‐ to 20‐fold lower compared to juices with the same fenbuconazole concentration fermented at 78 mg L−1 YAN. When the YAN concentration was 153 mg L−1, all treatments fermented completely. Finally, there was no difference in RS concentration at any concentration of fenbuconazole when the YAN concentration was 253 mg L−1 (Table 3). There was an interaction effect of YAN and fenbuconazole on RS (P = 0.0006) (Fig. 7D).The effect of fenbuconazole on RS at a low YAN concentration becomes negligible at high YAN concentrations (Fig. 7D). This further corroborates the finding that increasing YAN lessens the impact of fenbuconazole on yeast growth and metabolism. There was no difference in CO2 when fenbuconazole was added to juice with153 or 253 mg L−1 YAN (Table 3). Even though CO2 production did not decrease with an increasing YAN from 153 to 253 mg L−1, there was a significant correlation between an increasing YAN and a decreasing CO2 when fenbuconazole was added at either concentration (P < 0.01) (Fig. 7C). This supports the hypothesis of the present study suggesting that increasing the YAN concentration contributes to an increased fermentation rate, even when fenbuconazole is present. The addition of fenbuconazole did not affect H2S production for any of the YAN treatments.
CONCLUSIONS
As a result of the complex chemical nature of the apple juice/cider matrix and the interactive effects of many factors on fermentation performance, it is difficult to determine the complete impact of fungicide residues on cider fermentation and product quality. Notwithstanding, the present study showed that fungicide residues can impact fermentation rate, particularly under conditions of low YAN concentration. Specifically, residues of fenbuconazole should be of specific concern to cidermakers, even at low concentrations. Fludioxonil applications for the post‐harvest storage of apples are not likely to negatively affect fermentation kinetics during cider fermentation. Fermentation kinetics and H2S production within a given yeast strain differed across fungicides in the present study, likely as a result of differences in fungicide chemistry and the mode of action. Because fungicide applications differ widely across fruit production systems and regions, this observation is of special concern to emerging apple and grape growing regions that contend with relatively high fungal disease pressure, such as the Eastern USA. The results of the present study indicate that the presence of fungicide residues should be added to the growing list of factors beyond starting Brix, which should be taken into consideration when determining the minimum YAN concentration for cider fermentation. Determining regionally specific guidelines for minimum YAN concentration in cider will require further research into the effects on fermentation rate and H2S production of interactions between YAN and fungicide residues, as well as other juice matrix factors.
ACKNOWLEDGEMENTS
This research was funded by a USDA‐NIFA Specialty Crop Block Grant administered through the Virginia Department of Agriculture and Consumer Services, and through research support for Drs Amanda Stewart and Gregory Peck through the Virginia Tech Agricultural Experiment Station. The authors also thank Ken Hurley, Ann Sandbrook, Allen Cochran II, Melissa Wright, Sihui Ma, Nick Patrick and Dr Keith Yoder.
REFERENCES
- 1. Kumar GR, Ramakrishnan V and Bisson LF, Survey of hydrogen sulfide production in wine strains of Saccharomyces cerevisiae . Am J Enol Vitic 61:365–371 (2010). [Google Scholar]
- 2. Ugliano M, Kolouchova R and Henschke PA, Occurrence of hydrogen sulfide in wine and in fermentation: influence of yeast strain and supplementation of yeast available nitrogen. J Ind Microbiol Biotechnol 38:423–429 (2011). [DOI] [PubMed] [Google Scholar]
- 3. Giudici P and Kunkee RE, The effect of nitrogen deficiency and sulfur‐containing amino acids on the reduction of sulfate to hydrogen sulfide by wine yeasts. Am J Enol Vitic 45:107–112 (1994). [Google Scholar]
- 4. Jiranek V, Langridge P and Henschke PA, Regulation of hydrogen sulfide liberation in wine‐producing Saccharomyces cerevisiae strains by assimilable nitrogen. Appl Environ Microbiol 61:461–467 (1995). [DOI] [PMC free article] [PubMed] [Google Scholar]
- 5. Vos P, Vos PJA and Gray RS, The origin and control of hydrogen sulfide during fermentation of grape must. Am J Enol Vitic 30:187 (1979). [Google Scholar]
- 6. Bohlscheid JC, Osborne JP, Ross CF and Edwards CG, Interactive effects of selected nutrients and fermentation temperature on H2S production by wine strains of Saccharomyces . J Food Qual 34:51–55 (2011). [Google Scholar]
- 7. Bizaj E, Curtin C, Cadez N and Raspor P, Interactions between industrial yeasts and chemical contaminants in grape juice affect wine composition profile. Food Technol Biotechnol 52:222 (2014). [Google Scholar]
- 8. Bell SJ and Henschke PA, Implications of nitrogen nutrition for grapes, fermentation and wine. Aust J Grape Wine Res 11:242–295 (2005). [Google Scholar]
- 9. Bisson LF, Stuck and sluggish fermentations. Am J Enol Vitic 50:107–119 (1999). [Google Scholar]
- 10. Sablayrolles J‐M, Dubois C, Manginot C, Roustan J‐L and Barre P, Effectiveness of combined ammoniacal nitrogen and oxygen additions for completion of sluggish and stuck wine fermentations. J Ferment Bioeng 82:377–381 (1996). [Google Scholar]
- 11. Tweedy BG, Inorganic sulfur as a fungicide, in Residue Reviews, ed. by Gunther F. and Gunther J. Springer, New York, NY, pp. 43–68 (1981). [Google Scholar]
- 12. Beffa T, Pezet R and Turian G, Multiple‐site inhibition by colloidal elemental sulfur (S°) of respiration by mitochondria from young dormant α spores of Phomopsis viticola. Physiol Plant 69:443–450 (1987). [Google Scholar]
- 13. Comitini F and Ciani M, Influence of fungicide treatments on the occurrence of yeast flora associated with wine grapes. Ann Microbiol 58:489–493 (2008). [Google Scholar]
- 14. Conner AJ, The comparative toxicity of vineyard pesticides to wine yeasts. Am J Enol Vitic 34:278–279 (1983). [Google Scholar]
- 15. Rankine BC, Nature, origin and prevention of hydrogen sulphide aroma in wines. J Sci Food Agric 14:79–91 (1963). [Google Scholar]
- 16. Schuetz M and Kunkee RE, Formation of hydrogen sulfide from elemental sulfur during fermentation by wine yeast. Am J Enol Vitic 28:137–144 (1977). [Google Scholar]
- 17. Thomas CS, Boulton RB, Silacci MW and Gubler WD, The effect of elemental sulfur, yeast strain, and fermentation medium on hydrogen sulfide production during fermentation. Am J Enol Vitic 44:211–216 (1993). [Google Scholar]
- 18. Wainwright T, Production of H2S by yeasts: role of nutrients. J Appl Bacteriol 34:161–171 (1971). [DOI] [PubMed] [Google Scholar]
- 19. Thoukis G and Stern LA, A review and some studies of the effect of sulfur on the formation of off‐odors in wine. Am J Enol Vitic 13:133–140 (1962). [Google Scholar]
- 20. Thomas CS, Gubler WD, Silacci MW and Miller R, Changes in elemental sulfur residues on pinot noir and cabernet sauvignon grape berries during the growing season. Am J Enol Vitic 44:205–210 (1993). [Google Scholar]
- 21. Metcalfe RJ, Shaw MW and Russell PE, The effect of dose and mobility on the strength of selection for DMI fungicide resistance in inoculated field experiments. Plant Pathol 49:546–557 (2000). [Google Scholar]
- 22. Agriculture USDA , Pesticide Data Program Annual Summary, Calendar Year 2014. Database. [Online]. Available: https://www.ams.usda.gov/datasets/pdp [4 November 2016]. [Google Scholar]
- 23. Kim JH, Campbell BC, Mahoney N, Chan KL, Molyneux RJ and May GS, Enhancement of fludioxonil fungicidal activity by disrupting cellular glutathione homeostasis with 2,5‐dihydroxybenzoic acid. FEMS Microbiol Lett 270:284–290 (2007). [DOI] [PubMed] [Google Scholar]
- 24. Rosslenbroich H‐J and Stuebler D, Botrytis cinerea – history of chemical control and novel fungicides for its management. Crop Protect 19:557–561 (2000). [Google Scholar]
- 25. Čuš F, Česnik HB, Bolta ŠV and Gregorčič A, Pesticide residues and microbiological quality of bottled wines. Food Control 21:150–154 (2010). [Google Scholar]
- 26. García MA, Oliva J, Barba A, Cámara MÁ, Pardo F and Díaz‐Plaza EM, Effect of fungicide residues on the aromatic composition of white wine inoculated with three Saccharomyces cerevisiae strains. J Agric Food Chem 52:1241–1247 (2004). [DOI] [PubMed] [Google Scholar]
- 27. Zoecklein B, Fugelsang KC, Gump B and Nury FS, Wine Analysis and Production. Springer Science & Business Media, New York, NY: (2013). [Google Scholar]
- 28. Ugliano M and Henschke PA, Comparison of three methods for accurate quantification of hydrogen sulfide during fermentation. Anal Chim Acta 660:87–91 (2010). [DOI] [PubMed] [Google Scholar]
- 29. Sablayrolles JM, Barre P and Grenier P, Design of a laboratory automatic system for studying alcoholic fermentations in anisothermal enological conditions. Biotechnol Tech 1:181–184 (1987). [Google Scholar]
- 30. Tromp A, The effect of yeast strain, grape solids, nitrogen and temperature on fermentation rate and wine quality. S Afr J Enol Vitic 5:1–6 (1984). [Google Scholar]
- 31. Grosjean‐Cournoyer M‐C and Gouot J‐M, Fungicidal composition comprising a pyridylethylbenzamide derivative and a compound capable of inhibiting the ergosterol biosynthesis. Google Patent, EP1563731 A1 (2012). [Google Scholar]
- 32. Parks LW and Casey WM, Physiological implications of sterol biosynthesis in yeast. Annu Rev Microbiol 49:95–116 (1995). [DOI] [PubMed] [Google Scholar]
- 33. Kwasniewski MT, Sacks GL and Wilcox WF, Persistence of elemental sulfur spray residue on grapes during ripening and vinification. Am J Enol Vitic 65:453–462 (2014). [Google Scholar]
- 34. Rauhut D, Usage and formation of sulphur compounds, in Biology of Microorganisms on Grapes, in Must and in Wine, ed. by König H, Unden G. and Fröhlich J. Springer, Berlin, pp. 181–207 (2009). [Google Scholar]
- 35. Butzke CE and Park SK, Impact of fermentation rate changes on potential hydrogen sulfide concentrations in wine. J Microbiol Biotechnol 21:519–524 (2011). [DOI] [PubMed] [Google Scholar]
- 36. Park SK, Boulton RB and Noble AC, Formation of hydrogen sulfide and glutathione during fermentation of white grape musts. Am J Enol Vitic 51:91–97 (2000). [Google Scholar]
- 37. Acree TE, Sonoff EP and Splittstoesser DF, Effect of yeast strain and type of sulphur compound on hydrogen sulphide production. Am J Enol Vitic 23:6–9 (1972). [Google Scholar]
- 38. Bely M, Sablayrolles J‐M and Barre P, Automatic detection of assimilable nitrogen deficiencies during alcoholic fermentation in oenological conditions. J Ferment Bioeng 70:246–252 (1990). [Google Scholar]
- 39. Alberti A, Vieira RG, Drilleau JF, Wosiacki G and Nogueira A, Apple wine processing with different nitrogen contents. Braz Arch Biol Technol 54:551–558 (2011). [Google Scholar]
- 40. Varela C, Pizarro F and Agosin E, Biomass content governs fermentation rate in nitrogen‐deficient wine musts. Appl Environ Microbiol 70:3392–3400 (2004). [DOI] [PMC free article] [PubMed] [Google Scholar]


