Abstract
We report the effects of two-dimensional graphene nanostructures; graphene nano-onions (GNOs), graphene oxide nanoribbons (GONRs), and graphene oxide nanoplatelets (GONPs) on viability, and differentiation of human mesenchymal stem cells (MSCs). Cytotoxicity of GNOs, GONRs, and GONPs dispersed in distearoyl-sn-glycero-3-phosphoethanolamine-N-[amino(polyethylene glycol)] (DSPE-PEG), on adipose derived mesenchymal stem cells (adMSCs), and bone marrow-derived mesenchymal stem cells (bmMSCs) was assessed by AlamarBlue and Calcein AM viability assays at concentrations ranging from 5–300 μg/ml for 24 or 72 hours. Cytotoxicity of the 2D graphene nanostructures was found to be dose dependent, not time dependent, with concentrations less than 50 μg/ml showing no significant differences compared to untreated controls. Differentiation potential of adMSCs to adipocytes and osteoblasts, --characterized by Oil Red O staining and elution, alkaline phosphatase activity, calcium matrix deposition and Alizarin Red S staining-- did not change significantly when treated with the three graphene nanoparticles at a low (10 μg/ml) and high (50 μg/ml) concentration for 24 hours. Transmission electron microscopy (TEM) and confocal Raman spectroscopy indicated cellular uptake of only GNOs and GONPs. The results lay the foundation for the use of these nanoparticles at potentially safe doses as ex vivo labels for MSC-based imaging and therapy.
1. Introduction
Carbon nanoparticles such as zero dimensional (0D) fullerene, one dimensional (1D) carbon nanotubes, and recently two dimensional (2D) graphene [1] have been investigated for applications in therapeutics [2–5], bioimaging [6–8], and regenerative medicine [9]. Mesenchymal stem cells (MSCs) are an important class of adult or somatic stem cells, found in various tissues including bone marrow and adipose tissue. MSCs are multipotent cells that differentiate readily into osteocytes, chondrocytes, or adipocytes; express phenotypic characteristics of endothelial, neural, smooth muscle, skeletal myoblasts, and cardiac myocyte cells; and support hematopoietic stem cells or embryonic stem cells in culture [10–12]. MSC therapies are currently being widely investigated to repair, regenerate, and restore damaged tissues [13, 14], with some of these therapies in clinical trials [15, 16].
Nanoparticles have been employed to deliver growth factors/genes into MSCs to manipulate their differentiation [17, 18]. They have also been used as contrast agents/nanoprobes for stem cell tracking [19, 20] to locate the site of stem cell activity, and determine the efficacy of the therapy. Recent reports have indicated that graphene nanoparticles show excellent efficacy as delivery agents of genes and biomolecules as well as multimodal imaging agents [21–23], and thus could be suitable as multifunctional agents for MSC imaging and therapy.
The development of graphene nanoparticles for MSC applications necessitates thorough examination of their effects and interactions with these cells to identify the potential therapeutic doses. To date, very few studies have investigated the cytotoxicity of graphene nanoparticle formulation with specific focus on progenitor cells, or MSCs [24, 25]. Zhang et. al. examined the toxicity of graphene quantum dots (GQDs), single reduced graphene sheets with diameters in the range of 5 to 10 nm, on three progenitor cell types: neurospheres cells, pancreas progenitor cells, and cardiac progenitor cells [24]. Akhavanet. al. employed umbilical cord-derived MSCs and investigated the size-dependent cytotoxicity of graphene oxide nanoplatelets and reduced graphene oxide nanoplatelets (prepared using the modified Hummer's method) [25].
Graphene nanoparticles, depending on the synthesis method, can exhibit different morphologies, chemical properties, and physical properties. Graphene nano-onions (GNOs) are spherically shaped concentric layers of graphene. Graphene nanoribbons (GONRs), synthesized using multiwalled carbon nanotubes, are ribbon-shaped graphene stacks. Graphene nanoplatelets (GONPs), synthesized using graphite as the starting material, are disc-shaped multi-layered graphene. Reports indicate that graphene nanoparticles, depending on their morphology and synthesis method, show diverse responses on cells and tissues [26–29]. Thus, it is necessary to systematically investigate the effects that graphene nanoparticles with different morphologies, synthesized by various methods, have on MSC viability and differentiation. In this study, the dose- and time- dependent effects were investigated of three graphene nanoparticles-- GNOs, GONRs, and GONPs-- which were water-dispersed with 1,2-distearoyl-sn-glycero-3-phosphoethanolamine-N-[amino(polyethylene glycol)] (DSPE-PEG), on the viability and differentiation of human MSCs.
2. Materials and Methods
2.1 Nanoparticle Synthesis and Characterization
2.1.1 Synthesis of nanomaterials
GNOs were purchased from Graphene Laboratories Inc. (NY, USA). GONRs were synthesized from multi-walled carbon nanotubes (MWCNTs) possessing outer diameters between 20–30 nm (Cat. No. 636487, Sigma Aldrich, New York, USA) using a modified longitudinal unzipping method [30]. GONPs were synthesized from graphite flakes using a modified Hummer's method [21]. Nanoparticles were dispersed in a 1.2 mg/ml solution of DSPE-PEG and bath sonicated for 1 hour to ensure homogenous stable dispersions before treating the cells.
2.1.2 Raman spectroscopy
Raman spectroscopy was performed using a WITec alpha300R Micro-Imaging Raman Spectrometer equipped with a 532 nm Nd-YAG excitation laser. Spectra were recorded between 50 –3750 cm−1 at room temperature.
2.1.3 Transmission electron microscopy
Nanomaterials were dispersed in ethanol:water (1:1) by probe sonication (Cole Parmer Ultrasonicator LPX 750) using a 1 sec “on”, 2 sec “off” cycle. The samples were subjected to ultracentrifugation (5000 rpm for 5 minutes), and the supernatant was dropped onto lacey carbon grids (300 mesh size, copper support, Ted Pella, USA). HRTEM imaging was performed using a JOEL 2100F high-resolution analytical transmission electron microscope at the Center for Functional Nanomaterials, Brookhaven National Laboratory, New York. Samples were imaged at an accelerating voltage of 200 kV.
2.1.4 Thermogravimetric analysis
Thermogravimetric analysis (TGA) was performed on GNOs, GONRs, and GONPs using a Perkin-Elmer Diamond 500 (Waltham, MA, USA) instrument at the Center for Functional Nanomaterials, Brookhaven National Laboratory, New York. The samples were heated from 50°C to 800°C with the heating rate of 10°C /min under the argon flow of 20 ml/min.
2.1.5 Zeta potential and hydrodynamic diameter
Zeta potential and hydrodynamic diameter of GNOs, GONRs, and GONPs dispersed in DSPE-PEG was measured at 25°C using Malvern Zetasizer Nano ZS instrument at the Center for Functional Nanomaterials, Brookhaven National Laboratory, New York. The electrophoretic mobility values were calculated based on three separate measurements of 20 runs each. The zeta potential values were calculated from the electrophoretic mobility by the software using the Helmholtz-Smoluchowski equation. The hydrodynamic diameter of nanoparticles was calculated by measuring the velocity of particles under Brownian motion using the Stokes-Einstein equation.
2.2 Cell Culture
Adult human MSCs were isolated from lipoaspirate (Lifeline Cat No. FC-0034) and normal bone marrow (Lonza Cat NO. PT-2501). StemLife™ MSC medium (Lifeline, Cat No. LL-0034) was used for cell cultures, with a media change every 2–3 days. The cells were incubated at 37° C and 5% CO2 throughout the experiment. Passages 4 through 8 were used for the studies.
2.3 Viability
Adipose-derived human MSCs (adMSCs) and bone marrow-derived MSCs (bmMSCs) were used for the viability studies. Cells were plated in 96-well plates with 5000 cells/well. Twenty-four hours after plating, the cells were treated with a 10% volume of DSPE-PEG (control), or of GNOs, GONRs, and GONPs concentrations at 0 μg/ml, 5 μg/ml, 10 μg/ml, 50 μg/ml, 100 μg/ml and 300 μg/ml. Viability was assessed 24 or 72 hours after treatment with alamarBlue and Calcein AM assays.
2.4 AlamarBlue
Viability of adMSCs and bmMSCs treated with various concentrations (0–300 μg/ml) of graphene nanoparticles was determined using an alamarBlue assay. Untreated cells were used as a positive control. Cells treated with ice-cold methanol were used as a negative control. Twenty-four or 72 hours after treatment, the culture media were removed from the wells. After washing the wells with phosphate buffer solution (PBS), 100 μl of media were added. Ten μl of alamarBlue (Life Technologies, St. Louis, MO, USA) reagent was added to the wells. After incubating for two hours, fluorescence was measured at an excitation wavelength of 530 nm and emission wavelength of 580 nm.
2.5 Calcein AM
Viability of cells treated with different concentrations (0–300 μg/ml) of graphene nanoparticles was evaluated with a Calcein AM assay. At each time point, culture media were removed, and each well was washed with 100 μl of PBS to remove nanoparticles. Next, the PBS was completely removed and 100 μl of 0.05% Calcein AM reagent was added to each well and incubated for 30 minutes at room temperature. The fluorescence was measured at an excitation wavelength of 485 nm and an emission wavelength of 530 nm.
2.6 Adipogenic differentiation
Adipose-derived MSCs (adMSCs) were used for the differentiation studies. adMSCs were plated in 24-well plates at a density of 20,000 cells/well. The cells were treated with DSPE-PEG and either 10 μg/ml or 50 μg/ml of GNOs, GONRs, or GONPs. After incubation with the nanoparticles for 24 hours, the wells were washed with PBS to remove nanoparticles and treated with adipogenic and osteogenic differentiation media (Lonza, Cat No. PT-3004 & PT-3002). For adipogenic differentiation, the wells were treated with three rounds of adipogenic induction media, three days each round, and then incubated with the adipogenic maintenance media for a total of 21 days, with a media change every three days. Adipogenic differentiation was characterized with Oil Red O staining and elution and quantification of this dye. For osteogenic differentiation, the cells were treated with the osteogenic media for 14 days. Alizarin red S staining, alkaline phosphatase activity, and calcium matrix deposition were analyzed as markers of osteogenic differentiation.
2.7 Oil Red O
A well-established protocol was used for staining triglycerides and esters within the cells. Oil Red O stain was used to determine differences in adipogenic differentiation between the groups [31]. After incubation, the culture media were removed from the wells, and the cells were washed with PBS. The wells were then treated with 1 ml of 4% paraformaldehyde solution for 10 minutes, followed by 60 minutes of incubation with 1ml of fresh 4% paraformaldehyde solution. The paraformaldehyde was then removed, and the cells were washed with water, followed by a 60% isopropanol solution. After drying at room temperature, the wells were filled with a 0.5ml Oil Red O working solution made of two parts Oil Red O stock solution (0.35% solution in isopropanol) with three parts isopropanol. The wells were then incubated for 10 minutes. Excess Oil Red O dye was removed by incubating with a 100% isopropanol solution for 10 minutes. The wells were then washed immediately with double-distilled water four times. They were then imaged using a BX-51 Olympus microscope (Hamburg, Germany). The concentration of Oil Red O dye eluted was quantified by optical absorbance (wavelength = 500 nm). Optical absorbance of elute from each well was measured in triplicates (Varioskan Flash, Thermo Electron, Finland) and compared to the 100% isopropanol controls.
2.8 Osteogenic differentiation
2.8.1 Alizarin Red S
The well-established Alizarin Red S staining method was used to characterize a mineralized matrix due to osteodifferentiation of adMSCs[32]. Alizarin Red S solution (40 mM) was prepared in water and adjusted to a pH of 4.1 using 0.5 N ammonium hydroxide. After incubation with differentiation media, media were removed from the wells and the cells were washed with PBS. The cells were fixed using 1 ml of a 4% paraformaldehyde solution for 15 minutes. After fixation, the wells were washed twice with deionized water, and 1 ml of Alizarin Red S was added to each well. Following 20 minutes of incubation with light shaking, the wells were washed four times with deionized water while shaking for five minutes. The wells were imaged using a BX-51 Olympus microscope (Hamburg, Germany).
2.8.2 Cellularity
The number of cells per well was determined using QuantiFluor Dye Systems (Promega, WI, USA). A standard curve of double-stranded DNA was used to determine DNA content in each well. Subsequently, a standard curve of a known number of adMSCs was used to determine the number of cells per well corresponding to the calculated DNA content. 100 μl of sample or standard were added to a 96-well plate. 100 μl of 1x TE buffer were added with 100 μl of a QuantiFluor dye working solution. The 96-well plate was incubated in the dark at room temperature for 10 minutes. Fluorescence for each well was measured at an excitation wavelength of 480 nm and an emission wavelength of 570 nm. Data are presented as number of cells per well.
2.8.3 Alkaline Phosphatase activity
The ALP activity for the cells was measured using a well-established protocol utilizing the conversion of p-nitrophenylphosphate (pNPP) to p-nitrophenolate [33]. To perform this assay, cells in a 24-well plate were washed with PBS, and 2 ml of fresh PBS were added. These cells were then lysed by sonication for 30 minutes. 100 μl of pNPP were added to the cell lysate, placed in a 96-well plate in triplicates, and incubated at 37°C for one hour. After incubation, 100 μl of NaOH stop solution was added to each well, and absorbance was measured at 405 nm (Varioskan Flash, Thermo Electron, Finland). Data are presented as ALP activity in μmol per minute per cell.
2.8.4 Calcium Matrix Deposition
Arsenazo III Calcium Assay was used to determine calcium matrix deposition [34]. 100 μl of cell lysate were placed in triplicates in a 96-well plate with an equal volume of 1 M acetic acid. After overnight incubation, 20 μl of solution from each well or calcium chloride standard was added to 280 μl of Arsenazo III Calcium Assay reagent in a 96-well plate. Absorbance was measured at 650 nm wavelength (Varioskan Flash, Thermo Electron, Finland).
2.9 Nanoparticle uptake
2.9.1 Transmission Electron Microscopy
Histological specimens for transmission electron microscopy (TEM) were prepared by standard techniques. Briefly, adMSCs were cultured on ACLAR embedding film (Electron Microscopy Sciences) and placed in a 6-well plate for 24 hours before being treated with a 10% volume of DSPE-PEG (control) or a 50 μg/ml concentration of GNOs, GONRs, and GONPs for 24 hours. Cells were then washed with PBS and fixed using 1 ml of a 1% glutaraldehyde solution for one hour. After fixation, glutaraldehyde was removed, and a 1% osmium tetroxide solution in 0.1M PBS was added to the cells. The samples were then dehydrated by graded ethanol washes, and embedded in Durcupan resin (Sigma Life Science, St. Louis, MO). Sections of 80 nm were cut using a Reichert-Jung UltracutE ultramicrotome and placed on formvar-coated slot copper grids. Uranyl acetate and lead citrate were used to counterstain the sections. Samples were viewed with a TEM (JOEL JEM-1400) at 120 kV, and digital images were acquired with a Gatan CCD Digital Camera system and compiled using Adobe Photoshop.
2.9.2 Confocal Raman Microscopy
For investigating cellular uptake of nanoparticles using confocal Raman microscopy, adMSCs were incubated with GNOs, GONRs, and GONPs at 50 μg/ml in glass chamber slides (Nunc Lab-Tek II) for 24 hours. Following incubation, the cells were washed with PBS and fixed with ice-cold methanol. Confocal microscopy images were taken using an excitation laser set at 532 nm on an Alpha combination microscope (WITec, Knoxville, TN). An objective of 100x was used for brightfield images, and area maps were constructed using G-band intensity of GNOs, GONRs, and GONPs respectively.
2.10 Statistics
Cell viability of the treated samples is presented as percentage of live cells compared to untreated cells at one day and three day time points. CD50 values, or the concentration at which 50% of the cells are viable, were calculated from viability vs. concentration graphs. Statistical significance of the difference in viability after one and three days between the control (PEG-DSPE) stem cells and the nanoparticle-treated stem cells was analyzed by the Kruskal-Wallis test with Dunn post hoc. Differences in differentiation of cells treated with 10 or 50 μg/ml of GNOs, GONRs, or GONPs were analyzed with the Kruskal-Wallis test with Dunn post hoc. All statistics were done using Graph Pad InStat 3 software with comparisons having p <0.05 considered to be significantly different.
3. Results
3.1 Nanoparticle Characterization
3.1.1 Transmission electron microscopy
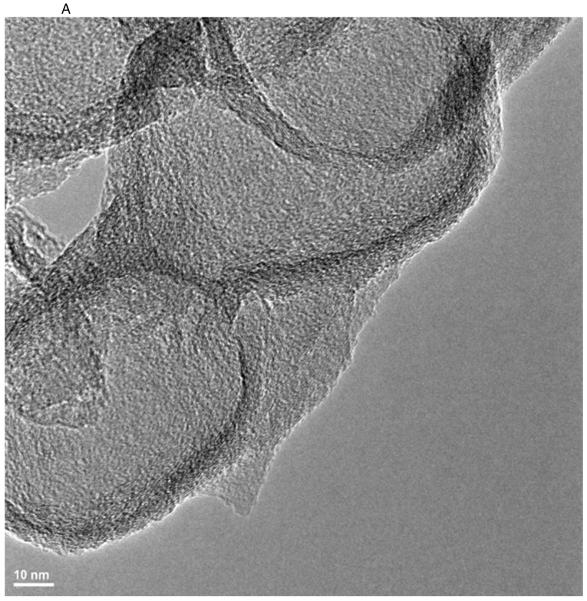
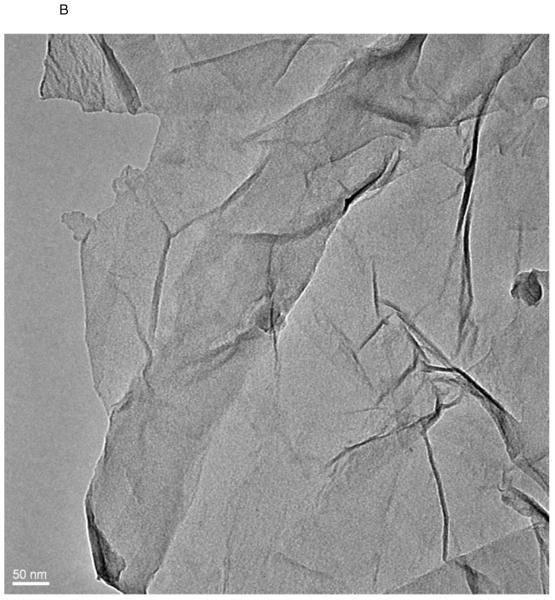
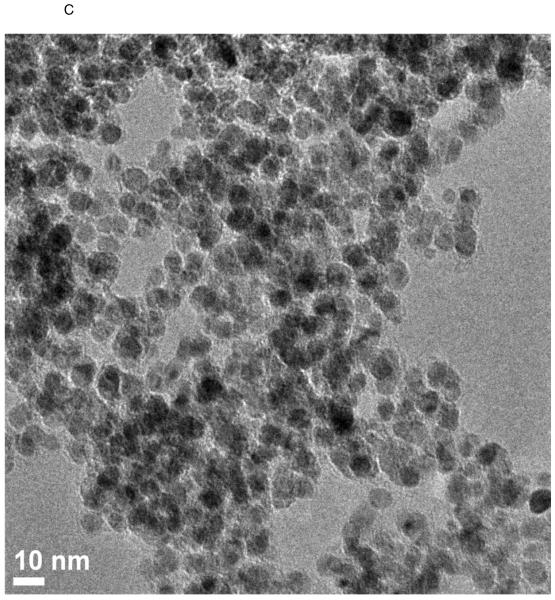
TEM images of various nanostructures are presented in Figure 1. GNOs (Figure 1 A) were hollow, multiwalled, and concentric polyhedral structures shaped like onions with diameters in the range of 50–300 nm. Multiwalled GONRs (Figure 1 B) appeared as rectangular sheets with breadths and lengths of ~60–90 nm and 500–1500 nm, respectively. GONPs (Figure 1 C) were disk-shaped with diameters between 20–40 nm and thicknesses between 3–5 nm.
Figure 1.
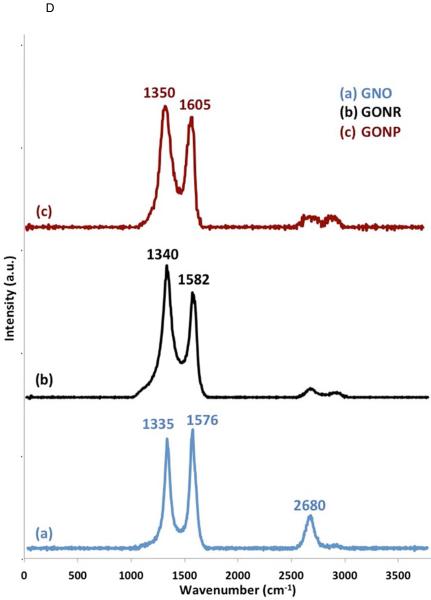
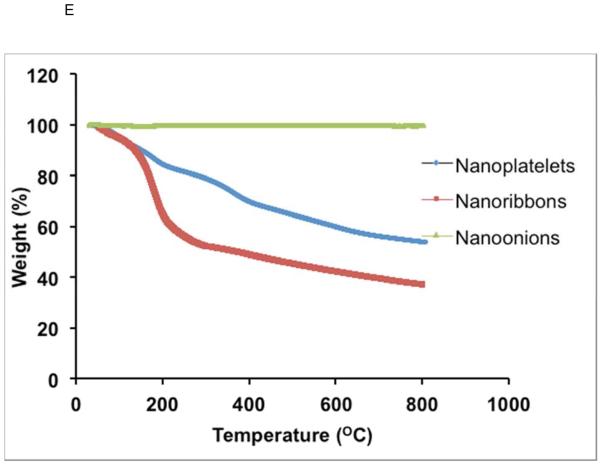
Representative HRTEM images of GNOs (A), GONRs (B), and GONPs (C). Scale bars: (A) 10 nm, (B) 50 nm, and (C) 10 nm. (D) Representative Raman spectra of GNOs (a), GONRs (b), and GONPs (c). (E) TGA profiles of GNOs, GONRs, and GONPs.
3.1.2 Raman spectroscopy
Representative Raman spectra of all the nanomaterials are presented in Figure 1 D. Peaks at 1335 cm−1 (D band), 1576 cm−1 (G band), and 2680 cm−1 (G' band) were observed for GNOs (Figure 1 D [a]). Peaks at 1340 cm−1 (D band) and 1580 cm−1 (G band) were observed for GONRs (Figure 1 D [b]), and peaks at 1351 cm−1 (D band) and 1604 cm−1 (G band) were observed for GONPs (Figure 1D [c]). The ID/IG ratios for GNOs, GONRs, and GONPs were 0.92, 1.28, and 1.09, respectively.
3.1.3 Thermogravimetric analysis
Figure 1 E shows TGA spectra of GNOs, GONRs, and GONPs. The TGA spectra of pristine GNOs showed a negligible weight loss of (~0.03%) up to 800°C. The thermal decomposition of GONRs and GONPs can be divided into three temperature zones: 0–100°C, 100–200°C and >200°C. GONRs showed ~10% weight loss and GONPs showed ~6% weight loss in the first temperature zone between 0–100°C. In the second temperature zone between 100–200°C, weight loss for GONRs and GONPs was ~30% and ~10%, respectively. In the third temperature zone (>200°C), both GONRs and GONPs showed a gradual weight loss of ~25%.
3.1.4 Zeta Potential and hydrodynamic diameter
The zeta potential and hydrodynamic diameter values for GNOs, GONRs, and GONPs are listed in Table 1. All nanomaterials were dispersed in DSPE-PEG and vortexed before measurements to ensure uniformity. The zeta potential values for GNOs, GONRs, and GONPs were −32.3±1.35 mV, −26.30±0.75 mV and −12.47±0.12 mV, respectively. The hydrodynamic diameter for GNOs was 460.76±53.58 nm; for GONRs was 457.5±35.70; and for GONPs was 296.4±20.32 nm.
Table 1.
Physicochemical characterization of GNOs, GONRs and GONPs by TEM, Raman spectroscopy and DLS.
| Nanoparticle | Dimensions (nm) | Raman Peaks | ID/IG | Zeta Potential (mV) | Hydrodynamic Diameter (nm) |
|---|---|---|---|---|---|
| GNO | (d) 50–300 | 1335 cm−1 (D), 1576 cm−1 (G), 2680 cm−1 (G') |
0.92 | −32.3±1.35 | 460.76±53.58 |
| GONR | (w) x (l) 60–90 × 500–1500 | 1340 cm−1 (D), 1580 cm−1 (G) |
1.28 | −26.30±0.75 | 457.5±35.70 |
| GONP | (d) 20–40 | 1351 cm−1 (D), 1604 cm−1 (G) |
1.09 | −12.47±0.12 | 296.4±20.32 |
3.2 Viability
3.2.1 AlamarBlue
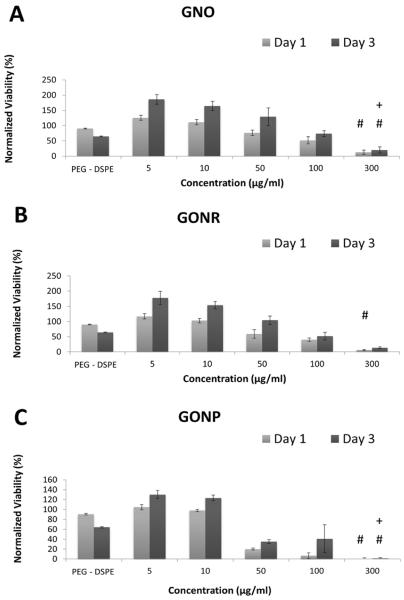
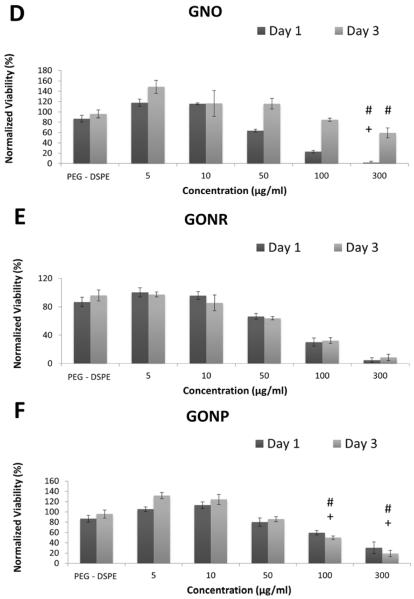
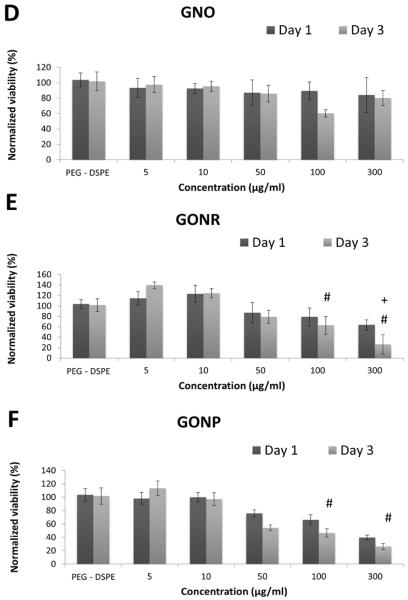
AlamarBlue assay works on the basis of conversion of resazurin to fluorescent resorufin by live cells [35]. Figure 3 shows viability of adMSCs (Figure 2 A, B and C) and bmMSCs (Figure 2 D, E and F) treated with GNOs (Figure 2 A and D), GONRs (Figure 2 B and E), and GONPs (Figure 2 C and F) at concentrations ranging from 0–300 μg/ml. The viability of the cells treated with DSPE-PEG alone was ~50% of controls in adMSCs and ~80% in bmMSCs: significantly lower compared to the untreated control. For the groups treated with GNOs, GONRs, and GONPs, viability decreased with increasing concentration. The lowest viability was at a nanoparticle concentration of 300 μg/ml for all groups. Table 2 lists the percentage decrease in viability at day one and day three for adMSCs and bmMSCs treated with 300 μg/ml concentration of GNOs, GONRs, or GONPs. Table 4 lists CD50 values of adMSCs and bmMSCs treated with GNOs, GONRs, and GONPs assessed by alamarBlue assay.
Figure 3.
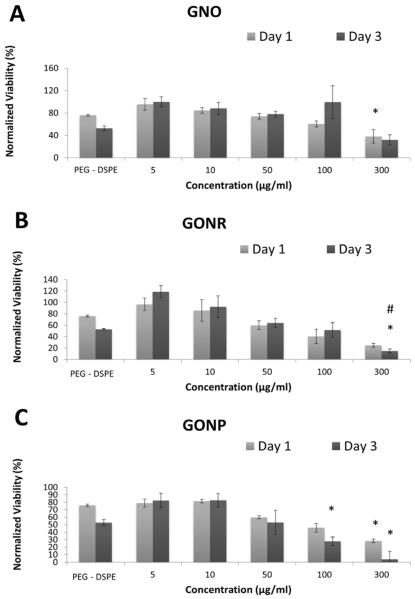
Calcein AM assay results at one and three days after treatment with GNOs (A), GONRs (B), and GONPs (C) for adMSCs; after treatment with GNOs (D), GONRs (E), and GONPs (F) for bmMSCs. For each nanoparticle, cells were treated with PEG-DSPE, at 5 μg/ml, 10 μg/ml, 50 μg/ml, 100 μg/ml, and 300 μg/ml concentrations. Data are presented as mean +/− standard deviation of percentage viability compared to untreated cells (n=4). Statistical significance (p<0.05) with respect to untreated groups, 5 μg/ml groups, and 10 μg/ml groups is denoted by (*), (#), and (+) respectively.
Figure 2.
AlamarBlue assay results at one and three days after treatment with GNOs (A), GONRs (B), and GONPs (C) for adMSCs; after treatment with GNOs (D), GONRs (E), and GONPs (F) for bmMSCs. For each nanoparticle, cells were treated with PEG-DSPE, 5 μg/ml, 10 μg/ml, 50 μg/ml, 100 μg/ml, and 300 μg/ml concentrations. Data are presented as mean +/− standard deviation of percentage viability compared to untreated cells (n=4). Statistical significance (p<0.05) with respect to untreated groups, 5 μg/ml groups, and 10 μg/ml groups is denoted by (*), (#), and (+) respectively.
Table 2.
Percentage decrease in viability assessed by Alamar Blue assay of adMSCs and bmMSCs treated with GNOs, GONRs and GONPs at concentration of 300 μg/ml at day 1 and 3 compared to control.
|
|
||||
|---|---|---|---|---|
| adMSC | bmMSC | |||
|
|
||||
| Day 1 | Day 3 | Day 1 | Day 3 | |
| GNOs | 86% | 69% | 50% | 39% |
| GONRs | 93% | 79% | 67% | 72% |
| GONPs | 100% | 98% | 62% | 93% |
Table 4.
CD50 values of adMSCs and bmMSCs treated with GNOs, GONRs and GONPs evaluated by Alamar Blue and CalceinAM assays.
| CD50 (μg/ml) |
||||
|---|---|---|---|---|
| adMSC | bmMSC | |||
|
|
||||
| Alamar Blue | Calcein AM | Alamar Blue | Calcein AM | |
| GNOs | 244 | 164 | 615 | 128 |
| GONRs | 142 | 137 | 200 | 123 |
| GONPs | 79 | 125 | 167 | 198 |
3.2.2 Calcein AM
Calcein AM is used to determine viability of cells by measuring fluorescence of calcein, which is a product of intercellular esterase activity in live cells [36]. Figure 3 displays the cell viability-- determined using Calcein AM assay-- on day one and day three of adMSCs (Figure 2 A, B and C) and bmMSCs (Figure 2 D, E and F) treated with GNOs (Figure 3 A and D), GONRs (Figure 3 B and E), and GONPs (Figure 3 C and F) at concentrations between 0–300 μg/ml. For both time points, the viability decreased with increasing nanoparticle concentration, with the lowest viability occurring at 300 μg/ml. Table 3 lists the decrease in viability at day one and day three for adMSCs and bmMSCs treated with a 300 μg/ml concentration of GNOs, GONRs, or GONPs. Table 4 lists CD50 values of adMSCs and bmMSCs treated with GNOs, GONRs, and GONPs assessed by Calcein AM assay.
Table 3.
Percentage decrease in viability assessed by Calcein AM assay of adMSCs and bmMSCs treated with GNOs, GONRs and GONPs at concentration of 300 μg/ml at day 1 and 3 compared to control.
|
|
||||
|---|---|---|---|---|
| adMSC | bmMSC | |||
|
|
||||
| Day 1 | Day 3 | Day 1 | Day 3 | |
| GNOs | 98% | 38% | 19% | 21% |
| GONRs | 94% | 91% | 39% | 74% |
| GONPs | 65% | 80% | 62% | 74% |
3.3 Adipogenic differentiation
3.3.1 Oil Red O Staining and Elution
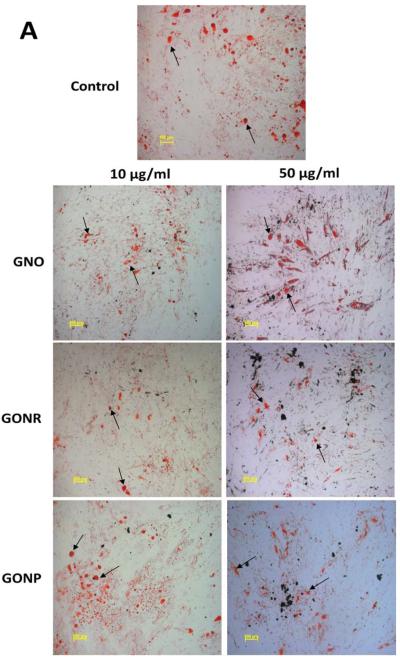
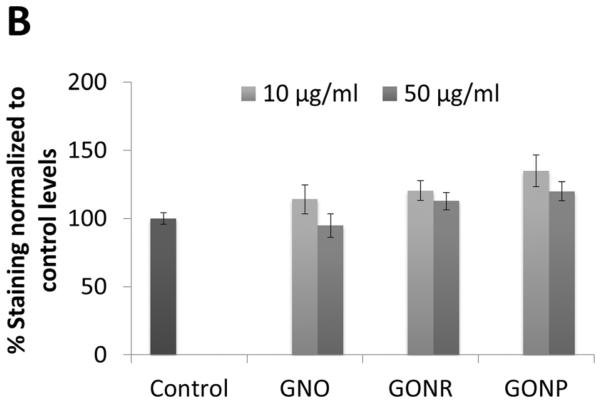
Oil Red O, a fat-soluble diazol dye, stains neutral lipids and cholesteryl esters without staining biological membranes [37]. Figure 4 A shows representative images of adMSCs stained with Oil Red O. The images were taken three weeks post 24 hour incubations with GNOs, GONRs, and GONPs. Fat vacuoles (black arrows, Figure 4 A) could be seen within the cells for all groups (including the control group) in optical microscopy images. Figure 4 B shows Oil Red O stain elution concentrations that allow quantification of adipocytes present in the experimental and controls groups. Elution concentrations showed no significant difference in staining in any of the graphene nanoparticle groups compared to the control.
Figure 4.
Adipogenesis results. (A) Histological specimens of adMSCs incubated with GNOs, GONRs, and GONPs for 24 hours, followed by incubation with adipogenic differentiation media for 21 days, stained by Oil Red O. (B) Elution of Oil Red O stain. Data are normalized to control values and presented as mean +/− standard deviation (n=3). Statistical significance (p<0.05) compared to the control was determined by the Kruskal-Wallis test with Dunn's post hoc (*).
3.4 Osteodifferentiation
3.4.1 Alizarin Red S
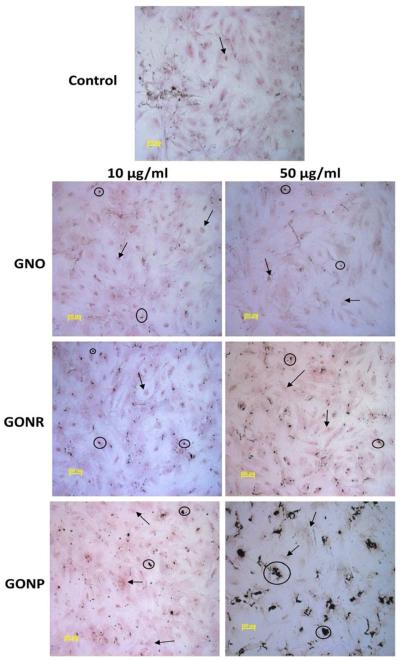
Alizarin Red S is a dye which binds to calcium and is used to detect calcium deposits in the extracellular matrix of cultured cells [38]. Figure 5 shows adMSCs stained with Alizarin Red S to characterize calcium deposition after incubation with GNOs, GONRs, or GONPs at concentrations of 10 and 50 μg/ml for 24 hours, followed by incubation with osteogenic media for 14 days. Red staining (black arrows) of calcium matrix deposition could be observed for all the groups. There was no difference in distribution of the staining pattern between the groups treated with graphene nanoparticles and those untreated. For cells treated with GNOs, traces of the nanoparticles (black circles) are seen in the images (Figure 5). There was a higher amount of nanoparticles with some traces of large aggregates observed in GONR treated cells. Groups treated with GONPs showed visible aggregates of varying sizes. Groups treated with 50 μg/ml of GONPs had large aggregates of nanoparticles with Alizarin Red S staining seen at a distance around these nanoparticles.
Figure 5.
Osteogenesis results. adMSCs after treatment for 24 hours with either 10 or 50 μg/ml of GNOs, GONRs, or GONPs respectively, followed by 14 days of incubation with osteogenic differentiation media stained with Alizarin Red S.
3.4.2 Cellularity
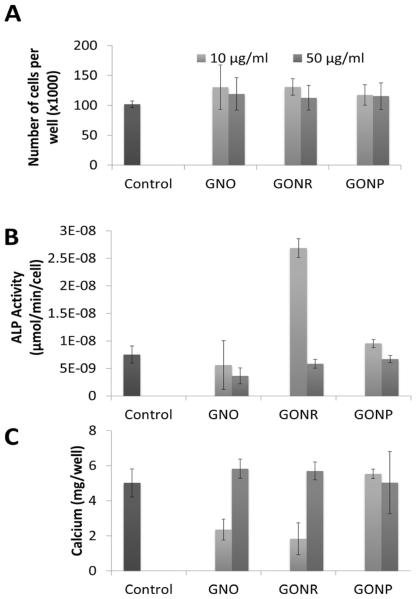
DNA content was quantified by QuantiFluor Dye Systems and used to determine cellularity of each group. The number of cells per well was used to calculate the ALP activity in each cell of the different groups. Figure 6 A shows the number of adMSCs per well after 24 hours of incubation with GNOs, GONRs, or GONPs at concentrations of 10 and 50 μg/ml, followed by 14 days of incubation with osteogenic differentiation media. There were ~100,000 cells in each well, with no significant differences between the treated groups or control.
Figure 6.
Osteogenesis results. (A) Cellularity for adMSCs after treatment for 24 hours with either 10 or 50 μg/ml of GNOs, GONRs, or GONPs, followed by 14 days of incubation with osteogenic differentiation media. (B) ALP activity in adMSCs after treatment for 24 hours with either 10 or 50 μg/ml of GNOs, GONRs, or GONPs, followed by 14 days of incubation with osteogenic differentiation media. (C) Calcium content after treatment for 24 hours with either 10 or 50 μg/ml of GNOs, GONRs, or GONPs, followed by 14 days of incubation with osteogenic differentiation media. Data are presented as mean +/− standard deviation of mg of calcium per well (n=3). Statistical significance (p<0.05) compared to the control was determined by the Kruskal-Wallis test with Dunn's post hoc (*).
3.4.3 Alkaline Phosphatase
Alkaline Phosphatase (ALP) is an early-stage marker in osteogenesis [39]. Figure 6 B shows ALP activity in adMSCs after 24 hours of incubation with GNOs, GONRs, or GONPs at concentrations of 10 and 50 μg/ml, followed by 14 days of incubation with osteogenic differentiation media. ALP activity between the groups ranged from 3.6 × 10⁻⁷ to 2.7 × 10⁻⁶ μmoles/min/cell, with no significant difference observed for all groups.
3.4.4 Calcium Matrix Deposition
Matrix calcium content is a late-stage marker of osteogenesis [34]. Figure 6 C shows calcium content per well for adMSCs treated with 10 or 50 μg/ml of GNOs, GONRs, or GONPs for 24 hours, followed by incubation with osteogenic differentiation media for 14 days. The calcium matrix content for all the groups ranged from 2–6 mg/well. At both concentrations, no significant difference in calcium content was found between the experimental and control groups.
3.5 Cell uptake
3.5.1 Transmission Electron Microscopy
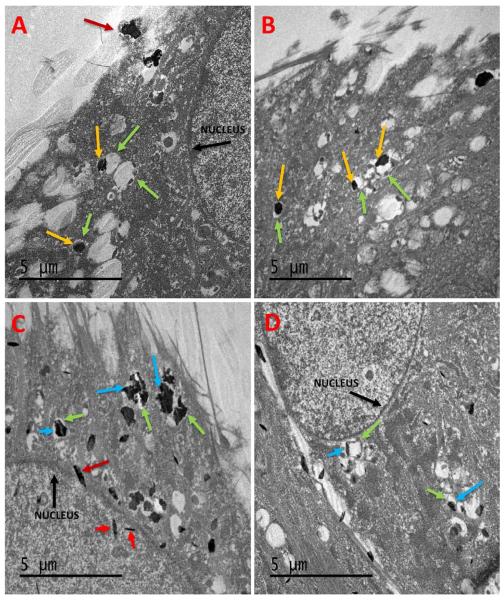
The uptake of nanoparticles into the cells was characterized by transmission electron microscopy (TEM). Figure 7 shows representative TEM images of cells incubated with GNOs and GONPs at concentration of 50 μg/ml for 24 hours. No cellular uptake of GONRs was observed. GNOs (yellow arrows, Figure 7 A& B) were found in the cell membrane (red arrow, Figure 7 A) and cytoplasmic vesicles (green arrows, Figure 7 A & B). GNO particles were absent in or around the nucleus (black arrow, Figure 7 A). For cells treated with GONPs (blue arrows, Figure 7 C & D), individual and aggregated nanoparticles were observed in vesicles (green arrows, Figure 7 C & D) throughout the cytoplasm. GONPs were also seen on the nuclear membrane and inside the nucleus (red arrows, Figure 7C).
Figure 7.
Representative TEM images of adMSCs treated with GNOs (A & B) and GONPs (C & D). GNOs aggregates (yellow arrow) are seen in vacuoles (green arrows) in the cytoplasm of the cell. GNOs are not seen inside the nucleus (black arrow). GONPs particles (blue arrows) are seen in the cytoplasm enclosed in vacuoles. They can also been seen inside the nucleus (red arrows).
3.5.2 Confocal Raman Microscopy
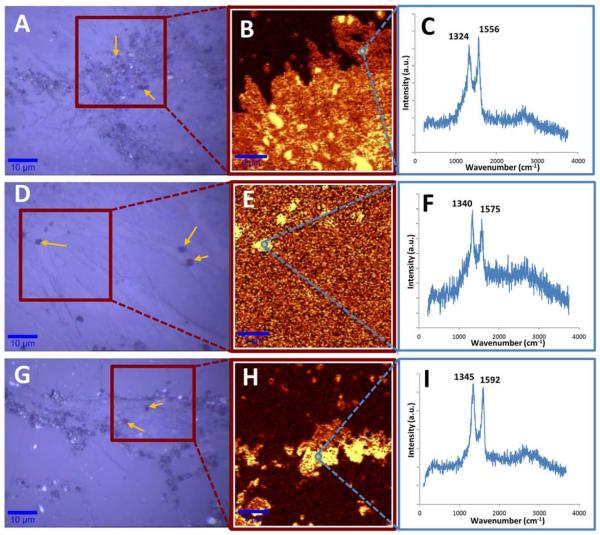
The TEM results were corroborated with confocal Raman mapping. G-band intensities of GNOs, GONRs, and GONPs were used to image the uptake of these nanoparticles into cells. Figure 8A displays representative bright-field microscope images showing GNOs (yellow arrows) within the cytoplasm of the cells. Figure 8B–C shows Raman microscopy analysis, confirming these particles as GNOs. Raman spectra of intracellular GNOs showed a red shift of the D- and G- bands compared to spectra of pristine samples shown in Figure 1(a). A large number of these particles were observed to gather around the nucleus. The bright-field image and Raman map indicate that the GNOs did not penetrate the nuclear membrane. Figure 8D shows bright-field images of adMSCs treated with GONRs. Aggregates of GONRs (yellow arrows) were seen in the extracellular space and embedded on the cell membrane. Figure 8E shows the confocal Raman map confirming the presence of GONRs on the outside of the cells. No characteristic GONR spectrum was noticed inside the cells. Figure 8G shows bright-field images of GONPs (yellow arrows) attached to the cell membrane, as well as within the cytoplasm of the cells. Raman mapping, shown in Figure 8H, confirmed the presence of GONPs within the cells, though there were no particular distribution patterns. Figure 8I shows the Raman spectra of intercellular GONPs, with a red shift on the D- and G- bands which could be related to their intercellular environment [40, 41].
Figure 8.
A, D and G show representative brightfield images of adMSCs treated with GNOs, GONRs, and GONPs, respectively. B, E, H show the confocal Raman map of selected regions in A, D, and G. Parts C, F and I show characteristic D- and G-band spectra of GNOs, GONRs, and GONPs employed to obtain confocal Raman maps of these nanoparticles.
4. Discussion
The objective of this study was to investigate the dose and time-dependent effects of aqueous dispersions of GNOs, GONRs, and GONPs on MSCs. Cellular interactions of graphene nanoparticles could depend on several factors, such as morphology (size and shape), surface charge, chemical state (functionalization), particulate state (dispersion), and the number of layers. These factors may also affect the cellular uptake and cytotoxicity [30, 42, 43]. Therefore, graphene nanoparticles with three distinct morphologies (onions – polyhedral spherical; ribbons – longitudinal flat sheets; and platelets – circular stacks of graphene) were included in this study. adMSCs and bmMSCs were chosen since these cells are widely used for stem cell imaging and therapy [44, 45]. Additionally, these cells can be isolated from bone marrow and adipose tissue from patients to maintain biocompatibility and minimize host rejection [46]. The initial cytotoxicity screening-- over a broad range of concentrations (0–300 μg/ml) and time points (one and three days)-- was performed on adMSCs and bmMSCs to identify a range of potentially safe doses. adMSCs were then employed to investigate whether these graphene nanoparticles at a potentially safe low and high dose affect the differential capabilities of MSCs. The cytotoxicity and differentiation studies together allowed identification of the range of doses for the three-graphene nanoparticle formulations that do not elicit any significantly adverse outcomes on the viability and differentiation capabilities of MSCs.
The Raman spectroscopy of GNOs, GONRs, and GONPs are presented in Figure 1 D. All the nanoparticles exhibit characteristic Raman spectra of graphene (presence of D, G, and 2D bands). The D-band is a first order Raman peak, corresponding to the presence of structural defects (disruption of C=C sp2 domains) in the graphene sheet. The G-band corresponds to the in-plane vibrations of pristine graphene (stretching between carbon-carbon bonds), whereas the G-band corresponds to the number of graphene layers [47]. The D-band, which occurs in the range of 1350 cm−1, is a one-phonon double resonance process [47]. The G-band, at about 2700 cm−1, is a two-phonon double resonance phenomenon [40, 47]. The ratio of D- and G-band intensities has been routinely used to infer the amount of defects in the sp2-bonded carbon [48]. Table 1 lists the ID/IG ratio for GNOs, GONRs, and GONPs. The ID/IG ratio for GNOs was slightly lower than GONRs and GONPs, but higher than pristine graphene sheets, which suggested the presence of structural defects. GONRs and GONPs showed an increased ID/IG ratio compared to pristine multi-walled carbon nanotubes and graphite flakes, which indicated the presence of defects attributed to the disruption of the sp2-bonded carbon due to oxidative unzipping of nanotubes [21, 49].
TGA has been widely used for characterization of carbon-based nanomaterials [49, 50]. As shown in Figure 1 E, the TGA spectra of pristine GNOs showed a negligible weight loss up to 800°C, confirming its high thermal stability and purity. The thermal decomposition of GONRs and GONPs observed between 0–100°C corresponds to the removal of adsorbed water vapor and other volatiles formed during their synthesis. The observed weight loss in the second temperature zone (between 100–200°C) can be attributed to the removal of hydroxyl and carboxylic acid and ester functional groups from the basal plane and edges of the graphene sheets. In the third temperature zone (>200°C), the observed weight loss corresponded to the gradual structural degradation of sp2 and sp3 bonded carbon atoms in GONRs and GONPs. A significantly higher weight loss was observed for GONRs and GONPs compared to GNOs, suggesting that the surface of GONRs and GONPs are highly functionalized.
Nanoparticles with a surface charge attract ions of the opposite charge, which form a thin electrical double layer around the surface of the nanoparticles. The electric potential at the boundary of the double layer is known as the zeta potential. As shown in Table 1, the zeta potential values for all the nanoparticles were negative. This can be attributed to the presence of hydroxyl and carboxyl functional groups on the surface of GNOs, GONRs, and GONPs during their synthesis. For colloidal suspension, zeta potential values greater than −30 mV are generally considered to have good stability. GNO and GONR dispersions in DSPE-PEG showed a zeta potential value of −32.3 ± 1.35 mV and –26.30 ± 0.75 mV, respectively, suggesting good and medium stability. GONP dispersions in DSPE-PEG showed a low zeta potential value of –12.47 ± 0.12 mV, which is too low for electrostatic stabilization. Although zeta potential plays a key role in determining the stability of colloidal dispersions, it does not measure the sizes of nanoparticles or their aggregates in dispersions. Dynamic light scattering is routinely employed for this purpose. This measures the hydrodynamic diameter: the diameter of a hypothetical sphere with a diffusion coefficient similar to that of the nanoparticle or aggregates in dispersion. The hydrodynamic diameter of GNOs, GONRs, and GONPs (Table 1) dispersed in DSPE-PEG were 460.76 ± 53.58 nm, 457.5 ± 35.70 nm, and 296.4 ± 20.32 nm, respectively. However, graphene particles have an anisotropic shape, so it is difficult to interpret whether the hydrodynamic diameter values refer to individual nanoparticles or their aggregates. Nevertheless, these numbers suggest that GNOs, GONRs, and GONPs dispersed in DSPE-PEG may exist as sub-micron sized aggregates.
The alamarBlue and calcein AM cytotoxicity assays showed a corresponding decrease in viability of both stem cell types with an increasing concentration of nanoparticles. Although the results of the two assays showed similar trends, the viability values for each assay were not similar. This variability is due to differences in how these assays assess viability, which in turn influence their sensitivity. At lower incubation concentrations (5 and 10 μg/ml) for all the graphene nanoparticle groups, the cells were more viable compared to the PEG-DSPE controls. Overall, for all groups, bmMSCs showed higher viability compared to adMSCs. A significant decrease in viability with an increase in time points was not observed consistently. The CD50 values followed the trend GNOs > GONRs > GONPs, and were >50 μg/ml for all three graphene nanoparticles The CD50 values of graphene nanoparticles have been shown to vary greatly based on synthesis methods, size, morphology, surface coatings, and cell types used for those investigations [25, 30, 42, 43]. These studies indicate that concentrations <50 μg/ml are relatively safe for most cell types. Taken together with the viability results of this study, GNOs, GONRs, or GONPs with incubation concentrations of ≤50 μg/ml could be potentially suitable for treating adMSCs and bmMSCs.
For differentiation studies, two representative differentiation pathways of MSCs, osteogenesis and adipogenesis, were chosen [51, 52]. adMSC were treated with two concentrations of the GNOs, GONRs, or GONPs: a low concentration of 10 μg/ml that showed near 100% viability at both time points, and a higher concentration of 50 μg/ml that showed >50% viability when compared to groups treated with DSPE-PEG. The assessment of adipogenesis by Oil Red O staining (Figures 4 A and B) indicated no significant differences in absorbance of Oil Red O stain elute for experimental and control groups. Assessment of ALP activity as an early indicator of osteogenesis of adMSCs showed normal levels at both concentrations, 14 days after treatment with GNOs, GONRs, or GONPs [33]. adMSCs treated with 10 μg/ml of GONRs had the highest ALP activity, ~75% compared to the control. However, this increase was not statistically significant. Assessment of calcium content, a late stage indicator of osteogenesis of adMSCs, showed calcium concentrations similar to untreated controls 14 days after treatment with GONPs at both concentrations. adMSCs treated with 50 μg/ml of GNOs or GONRs also showed calcium concentrations similar to untreated controls. Groups treated with 10 μg/ml of GNOs or GONRs showed approximately half the amount of calcium compared to groups treated at the 50 μg/ml concentration or untreated controls, even though the differences were not statistically significant. Alizarin Red S staining of calcium deposits further qualitatively confirms the above quantitative results. ALP is an early stage marker of osteo-differentiation and its activity declines as the matrix matures. In contrast, calcium is a late stage marker of osteodifferentiation, and its activity increases as the matrix matures. Thus, lower levels of ALP activity, combined with lower calcium concentrations for GNOs and GONRs at 10 μg/ml compared to untreated control groups, suggest that the matrix had not completely matured. This assessment is further corroborated by an Alizarin Red S stained histological evaluation.
TEM and confocal Raman microscopy of histological specimens of adMSCs treated with the various graphene nanoparticles showed differences in cellular uptake, and followed the trend GONRs < GNOs <GONPs. GONPs were found in the cytoplasm and nucleus; GNOs in cytoplasmic vacuoles; GONRs were not found within the cells. The red shift in Raman peaks for GNOs and GONPs could be related to their interaction with the intercellular environment [40, 41]. The differential uptake of the various graphene nanoparticle dispersions may be related their distinct size/aspect ratio, surface properties (charge and functional groups), and aggregation states (hydrodynamic diameter); -- attributes that could affect their uptake [53, 54]. However, a higher uptake of a graphene nanoparticle cannot be attributed as the main reason for the observed cytotoxicity[55]. As stated above, the CD50 values followed the trend GNOs > GONRs > GONPs, and suggest that GONRs are more cytotoxic compared to GONPs, even though they do not show cellular uptake. Thus, other reasons could also play a role, such as differences in reactive oxygen species (ROS) generation and/or peroxidation of cell membrane lipids by the various graphene nanoparticles [56].
The above results indicate that effects of GNOs, GONPs, and GONRs on MSCs are significantly different from studies with other types of graphene nanoparticles. A study by Zhang et. al. focused on the effects of graphene quantum dots (GQDs) on three progenitor cell types: neurospheres cells, pancreas progenitor cells, and cardiac progenitor cells. Zhang et. al. indicated that after 72 hours, at concentrations in the range of 1 to 200 μg/ml, all three cell types showed viability of at least 50% [24]. The lowest viability was observed with the 200 μg/ml treatment group, with decreases in viability of about 25% to 30% for all three cell types. GQDs also showed no effect on differentiation and proliferation of neurospheres. Akhavanet. al. [25] treated umbilical cord-derived MSCs with graphene nanoplatelets of four sizes: 11 ± 4 nm, 90 ± 37 nm, 418 ± 56 nm, and 3.8 ± 0.4 μm each at concentrations ranging from 0.01 μg/ml to 100 μg/ml. The results showed that the viability of cells incubated with various sizes of graphene oxide nanoplatelets for 24 hours were both size- and concentration-dependent. The smallest particles (size = 11 ± 4 nm) at a concentration of 100 μg/ml showed >50% reduction in viability. However, their effects on the differentiation of the MSCs were not reported in this study.
Several studies report that in vitro cytotoxicity and intracellular uptake mechanisms (such as passive diffusion and endosomal uptake) of nanoparticles are dependent on their surface charge and/or aggregation state [57, 58]. For instance, individually dispersed and small-sized graphene were more toxic than their aggregated counterparts [25, 43]. The results of TEM (Figure 1 A–C), Raman spectroscopy (Figure 1 D), TGA (Figure 1 E), zeta potential, and hydrodynamic diameter (Table 1) measurements of GNOs, GONRs, and GONPs taken together indicated that these graphene nanoparticles not only possess distinctly different morphological features, but also surface properties. Since the differences in cytotoxicity and cellular uptake results observed in this study are due to complex interplay of various physical and chemical properties of GNOs, GONRs, and GONPs, these results cannot be generalized for all graphene-based nanoparticles. More thorough investigations are currently underway to better understand the differences in cellular uptake of various graphene nanoparticles, including their uptake mechanism and the reasons for the observed variation in cell death.
Graphene-based formulations show promise as cellular contrast agents for bioimaging and as vectors for drug/gene delivery applications [6, 8, 59, 60]. These advancements offer opportunities to introduce these nanomaterials for stem cell imaging and therapy. A significant number of these stem cell applications would require ex vivo labeling of stem cells with these nanoparticles. The above results also provide guidelines on potential dose ranges, which could be further explored for the ex vivo labeling of MSCs with these three graphene nanoparticle formulations to identify the potential therapeutic doses for particular stem cell imaging or therapeutic applications.
5. Conclusion
GNOs, GONRs, and GONPs elicited a dose-dependent (0–300 μg/ml), but not a time-dependent (24 and 72 hours) cytotoxic response on adMSCs and bmMSCs. For all three nanoparticles, concentrations of less than 50 μg/ml showed no significant differences compared to untreated controls. The adipogenic and osteogenic differentiation potential of adMSCs was not adversely affected after treatment with a low (10 μg/ml) or high (50 μg/ml) concentration. GNOs and GONPs were internalized by adMSCs, while GONRs were not. The results suggest that GNOs, GONRs, and GONPs at concentrations of less than 50 μg/ml for 24 or 72 hours could be considered potentially safe incubation conditions for ex vivo labeling for MSCs. The results open avenues for use of these graphene nanoparticle formulations for ex vivo labeling of MSCs for applications in regenerative medicine.
Acknowledgements
This work was supported by the National Institutes of Health (grants No. 1DP2OD007394-01). The authors would like to thank Susan Van Horn (Central Microscopy, Stony Brook University) for her help with Transmission Electron Microscopy and Ms. Katrina Outland for language editing and proofreading of the manuscript. Research was carried out in part at the Center for Functional Nanomaterials, Brookhaven National Laboratory, New York, which is supported by the U.S. Department of Energy, Office of Basic Energy Sciences, under Contract No. DE-AC02-98CH10886.
Footnotes
Publisher's Disclaimer: This is a PDF file of an unedited manuscript that has been accepted for publication. As a service to our customers we are providing this early version of the manuscript. The manuscript will undergo copyediting, typesetting, and review of the resulting proof before it is published in its final citable form. Please note that during the production process errors may be discovered which could affect the content, and all legal disclaimers that apply to the journal pertain.
References
- [1].Xia Y, Yang P, Sun Y, Wu Y, Mayers B, Gates B, et al. One-Dimensional Nanostructures: Synthesis, Characterization, and Applications. Adv Mater. 2003;15:353–89. [Google Scholar]
- [2].Mendes RG, Bachmatiuk A, Büchner B, Cuniberti G, Rümmeli MH. Carbon nanostructures as multi-functional drug delivery platforms. J Mater Chem B Mater Biol Med. 2013;1:401–28. doi: 10.1039/c2tb00085g. [DOI] [PubMed] [Google Scholar]
- [3].Yang K, Hu L, Ma X, Ye S, Cheng L, Shi X, et al. Multimodal Imaging Guided Photothermal Therapy using Functionalized Graphene Nanosheets Anchored with Magnetic Nanoparticles. Adv Mater. 2012;24:1868–72. doi: 10.1002/adma.201104964. [DOI] [PubMed] [Google Scholar]
- [4].Yang K, Zhang S, Zhang G, Sun X, Lee ST, Liu Z. Graphene in mice: ultrahigh in vivo tumor uptake and efficient photothermal therapy. Nano Lett. 2010;10:3318–23. doi: 10.1021/nl100996u. [DOI] [PubMed] [Google Scholar]
- [5].Lalwani G, Sitharaman B. Multifunctional fullerene- and metallofullerene-based nanobiomaterials. Nano Life. 2013;03:1342003. [Google Scholar]
- [6].Lalwani G, Cai X, Nie L, Wang LV, Sitharaman B. Graphene-based contrast agents for photoacoustic and thermoacoustic tomography. Photoacoustics. 2013;1:62–7. doi: 10.1016/j.pacs.2013.10.001. [DOI] [PMC free article] [PubMed] [Google Scholar]
- [7].Avti PK, Talukdar Y, Sirotkin MV, Shroyer KR, Sitharaman B. Toward single-walled carbon nanotube-gadolinium complex as advanced MRI contrast agents: Pharmacodynamics and global genomic response in small animals. J Biomedical Mater Res B Appl Biomater. 2013;101:1039–49. doi: 10.1002/jbm.b.32914. [DOI] [PMC free article] [PubMed] [Google Scholar]
- [8].Kanakia S, Toussaint JD, Chowdhury SM, Lalwani G, Tembulkar T, Button T, et al. Physicochemical characterization of a novel graphene-based magnetic resonance imaging contrast agent. Int J Nanomedicine. 2013;8:2821–33. doi: 10.2147/IJN.S47062. [DOI] [PMC free article] [PubMed] [Google Scholar]
- [9].Lalwani G, Henslee AM, Farshid B, Lin L, Kasper FK, Qin YX, et al. Two-dimensional nanostructure-reinforced biodegradable polymeric nanocomposites for bone tissue engineering. Biomacromolecules. 2013;14:900–9. doi: 10.1021/bm301995s. [DOI] [PMC free article] [PubMed] [Google Scholar]
- [10].Friedenstein A, Piatetzky-Shapiro I, Petrakova K. Osteogenesis in transplants of bone marrow cells. J Embryol Exp Morph. 1966;16:381–90. [PubMed] [Google Scholar]
- [11].Young RG, Butler DL, Weber W, Caplan AI, Gordon SL, Fink DJ. Use of mesenchymal stem cells in a collagen matrix for Achilles tendon repair. J Orthop Res. 2005;16:406–13. doi: 10.1002/jor.1100160403. [DOI] [PubMed] [Google Scholar]
- [12].Smith RKW, Korda M, Blunn GW, Goodship AE. Isolation and implantation of autologous equine mesenchymal stem cells from bone marrow into the superficial digital flexor tendon as a potential novel treatment. Equine Vet J. 2003;35:99–102. doi: 10.2746/042516403775467388. [DOI] [PubMed] [Google Scholar]
- [13].Caplan AI. Mesenchymal stem cells. J Orthopaed Res. 1991;9:641–50. doi: 10.1002/jor.1100090504. [DOI] [PubMed] [Google Scholar]
- [14].Shang Q, Wang Z, Liu W, Shi Y, Cui L, Cao Y. Tissue-Engineered Bone Repair of Sheep Cranial Defects with Autologous Bone Marrow Stromal Cells. J Craniofac Surg. 2001;12:586–93. doi: 10.1097/00001665-200111000-00017. [DOI] [PubMed] [Google Scholar]
- [15].Kang H-J, Kim H-S, Koo B-K, Kim Y-J, Lee D, Sohn D-W, et al. Intracoronary infusion of the mobilized peripheral blood stem cell by G-CSF is better than mobilization alone by G-CSF for improvement of cardiac function and remodeling: 2-year follow-up results of the Myocardial Regeneration and Angiogenesis in Myocardial Infarction with G-CSF and Intra-Coronary Stem Cell Infusion (MAGIC Cell) 1 trial. Am Heart J. 2007;153:237, e1–e8. doi: 10.1016/j.ahj.2006.11.004. [DOI] [PubMed] [Google Scholar]
- [16].Janssens S, Dubois C, Bogaert J, Theunissen K, Deroose C, Desmet W, et al. Autologous bone marrow-derived stem-cell transfer in patients with ST-segment elevation myocardial infarction: double-blind, randomised controlled trial. The Lancet. 2006;367:113–21. doi: 10.1016/S0140-6736(05)67861-0. [DOI] [PubMed] [Google Scholar]
- [17].Corsi K, Chellat F, Yahia LH, Fernandes JC. Mesenchymal stem cells, MG63 and HEK293 transfection using chitosan-DNA nanoparticles. Biomaterials. 2003;24:1255–64. doi: 10.1016/s0142-9612(02)00507-0. [DOI] [PubMed] [Google Scholar]
- [18].Cao X, Deng W, Wei Y, Yang Y, Su W, Wei Y, et al. Incorporating pTGF-β1/calcium phosphate nanoparticles with fibronectin into 3-dimensional collagen/chitosan scaffolds: efficient, sustained gene delivery to stem cells for chondrogenic differentiation. Eur Cell Mater. 2012;23:81–93. doi: 10.22203/ecm.v023a06. [DOI] [PubMed] [Google Scholar]
- [19].Lee JH, Jung MJ, Hwang YH, Lee YJ, Lee S, Lee DY, et al. Heparin-coated superparamagnetic iron oxide for in vivo MR imaging of human MSCs. Biomaterials. 2012;33:4861–71. doi: 10.1016/j.biomaterials.2012.03.035. [DOI] [PubMed] [Google Scholar]
- [20].Reddy AM, Kwak BK, Shim HJ, Ahn C, Lee HS, Suh YJ, et al. In vivo tracking of mesenchymal stem cells labeled with a novel chitosan-coated superparamagnetic iron oxide nanoparticles using 3.0T MRI. J Korean Med Sci. 2010;25:211–19. doi: 10.3346/jkms.2010.25.2.211. [DOI] [PMC free article] [PubMed] [Google Scholar]
- [21].Paratala BS, Jacobson BD, Kanakia S, Francis LD, Sitharaman B. Physicochemical characterization, and relaxometry studies of micro-graphite oxide, graphene nanoplatelets, and nanoribbons. PLoS One. 2012;7:e38185. doi: 10.1371/journal.pone.0038185. [DOI] [PMC free article] [PubMed] [Google Scholar]
- [22].Bao H, Pan Y, Ping Y, Sahoo NG, Wu T, Li L, et al. Chitosan - Functionalized Graphene Oxide as a Nanocarrier for Drug and Gene Delivery. Small. 2011;7:1569–78. doi: 10.1002/smll.201100191. [DOI] [PubMed] [Google Scholar]
- [23].Chen B, Liu M, Zhang L, Huang J, Yao J, Zhang Z. Polyethylenimine-functionalized graphene oxide as an efficient gene delivery vector. J Mater Chem. 2011;21:7736–41. [Google Scholar]
- [24].Zhang M, Bai L, Shang W, Xie W, Ma H, Fu Y, et al. Facile synthesis of water-soluble, highly fluorescent graphene quantum dots as a robust biological label for stem cells. J Mater Chem. 2012;22:7461–7. [Google Scholar]
- [25].Akhavan O, Ghaderi E, Akhavan A. Size-dependent genotoxicity of graphene nanoplatelets in human stem cells. Biomaterials. 2012;33:8017–25. doi: 10.1016/j.biomaterials.2012.07.040. [DOI] [PubMed] [Google Scholar]
- [26].Wang X, Podila R, Shannahan JH, Rao AM, Brown JM. Intravenously delivered graphene nanosheets and multiwalled carbon nanotubes induce site-specific Th2 inflammatory responses via the IL-33/ST2 axis. Int J Nanomedicine. 2013;8:1733. doi: 10.2147/IJN.S44211. [DOI] [PMC free article] [PubMed] [Google Scholar]
- [27].Shen J, Hu Y, Li C, Qin C, Ye M. Synthesis of amphiphilic graphene nanoplatelets. Small. 2009;5:82–5. doi: 10.1002/smll.200800988. [DOI] [PubMed] [Google Scholar]
- [28].Kosynkin DV, Higginbotham AL, Sinitskii A, Lomeda JR, Dimiev A, Price BK, et al. Longitudinal unzipping of carbon nanotubes to form graphene nanoribbons. Nature. 2009;458:872–6. doi: 10.1038/nature07872. [DOI] [PubMed] [Google Scholar]
- [29].Delgado JL, Herranz MÁ, Martín N. The nano-forms of carbon. J Mater Chem. 2008;18:1417–26. [Google Scholar]
- [30].Mullick Chowdhury S, Lalwani G, Zhang K, Yang JY, Neville K, Sitharaman B. Cell specific cytotoxicity and uptake of graphene nanoribbons. Biomaterials. 2013;34:283–93. doi: 10.1016/j.biomaterials.2012.09.057. [DOI] [PMC free article] [PubMed] [Google Scholar]
- [31].Hong L, Peptan IA, Colpan A, Daw JL. Adipose tissue engineering by human adipose-derived stromal cells. Cells Tissues Organs. 2006;183:133–40. doi: 10.1159/000095987. [DOI] [PubMed] [Google Scholar]
- [32].Majors AK, Boehm CA, Nitto H, Midura RJ, Muschler GF. Characterization of human bone marrow stromal cells with respect to osteoblastic differentiation. J Orthop Res. 2005;15:546–57. doi: 10.1002/jor.1100150410. [DOI] [PubMed] [Google Scholar]
- [33].Boufker HI, Lagneaux L, Najar M, Piccart M, Ghanem G, Body JJ, et al. The Src inhibitor dasatinib accelerates the differentiation of human bone marrow-derived mesenchymal stromal cells into osteoblasts. BMC Cancer. 2010;10:298. doi: 10.1186/1471-2407-10-298. [DOI] [PMC free article] [PubMed] [Google Scholar]
- [34].Mikos AG. Effect of bone extracellular matrix synthesized in vitro on the osteoblastic differentiation of marrow stromal cells. Biomaterials. 2005;26:971–7. doi: 10.1016/j.biomaterials.2004.04.001. [DOI] [PubMed] [Google Scholar]
- [35].O'Brien J, Wilson I, Orton T, Pognan F. Investigation of the Alamar Blue (resazurin) fluorescent dye for the assessment of mammalian cell cytotoxicity. Eur J Biochem. 2003;267:5421–6. doi: 10.1046/j.1432-1327.2000.01606.x. [DOI] [PubMed] [Google Scholar]
- [36].Gupta AK, Wells S. Surface-modified superparamagnetic nanoparticles for drug delivery: preparation, characterization, and cytotoxicity studies. IEEE Trans Nanobiosci. 2004;3:66–73. doi: 10.1109/tnb.2003.820277. [DOI] [PubMed] [Google Scholar]
- [37].Mehlem A, Hagberg CE, Muhl L, Eriksson U, Falkevall A. Imaging of neutral lipids by oil red O for analyzing the metabolic status in health and disease. Nat Protoc. 2013;8:1149–54. doi: 10.1038/nprot.2013.055. [DOI] [PubMed] [Google Scholar]
- [38].Krause U, Seckinger A, Gregory CA. Assays of Osteogenic Differentiation by Cultured Human Mesenchymal Stem Cells. Science. 2011:215–30. doi: 10.1007/978-1-60761-999-4_17. [DOI] [PubMed] [Google Scholar]
- [39].Toquet J, Rohanizadeh R, Guicheux J, Couillaud S, Passuti N, Daculsi G, et al. Osteogenic potential in vitro of human bone marrow cells cultured on macroporous biphasic calcium phosphate ceramic. J Biomed Mater Res. 1999;44:98–108. doi: 10.1002/(sici)1097-4636(199901)44:1<98::aid-jbm11>3.0.co;2-p. [DOI] [PubMed] [Google Scholar]
- [40].Heller DA, Baik S, Eurell TE, Strano MS. Single - Walled Carbon Nanotube Spectroscopy in Live Cells: Towards Long - Term Labels and Optical Sensors. Adv Mater. 2005;17:2793–9. [Google Scholar]
- [41].Strano MS, Huffman CB, Moore VC, O'Connell MJ, Haroz EH, Hubbard J, et al. Reversible, band-gap-selective protonation of single-walled carbon nanotubes in solution. J Phys Chem B. 2003;107:6979–85. [Google Scholar]
- [42].Liao K-H, Lin Y-S, Macosko CW, Haynes CL. Cytotoxicity of graphene oxide and graphene in human erythrocytes and skin fibroblasts. ACS Appl Mater Interfaces. 2011;3:2607–15. doi: 10.1021/am200428v. [DOI] [PubMed] [Google Scholar]
- [43].Mao HY, Laurent S, Chen W, Akhavan O, Imani M, Ashkarran AA, et al. Graphene: promises, facts, opportunities, and challenges in nanomedicine. Chem Rev. 2013;113:3407–24. doi: 10.1021/cr300335p. [DOI] [PubMed] [Google Scholar]
- [44].Khurana A, Chapelin F, Beck G, Lenkov OD, Donig J, Nejadnik H, et al. Iron Administration before Stem Cell Harvest Enables MR Imaging Tracking after Transplantation. Radiology. 2013;269:186–97. doi: 10.1148/radiol.13130858. [DOI] [PMC free article] [PubMed] [Google Scholar]
- [45].Murphy JM, Fink DJ, Hunziker EB, Barry FP. Stem cell therapy in a caprine model of osteoarthritis. Arthritis Rheum. 2003;48:3464–74. doi: 10.1002/art.11365. [DOI] [PubMed] [Google Scholar]
- [46].Strauer BE, Kornowski R. Stem cell therapy in perspective. Circulation. 2003;107:929–34. doi: 10.1161/01.cir.0000057525.13182.24. [DOI] [PubMed] [Google Scholar]
- [47].Dresselhaus MS, Dresselhaus G, Saito R, Jorio A. Raman spectroscopy of carbon nanotubes. Phys Rep. 2005;409:47–99. [Google Scholar]
- [48].Salzmann CG, Llewellyn SA, Tobias G, Ward MA, Huh Y, Green ML. The Role of Carboxylated Carbonaceous Fragments in the Functionalization and Spectroscopy of a Single - Walled - Nanotube Material. Adv Mater. 2007;19:883–7. [Google Scholar]
- [49].Kosynkin DV, Higginbotham AL, Sinitskii A, Lomeda JR, Dimiev A, Price BK, et al. Longitudinal unzipping of carbon nanotubes to form graphene nanoribbons. Nature. 2009;458:872–6. doi: 10.1038/nature07872. [DOI] [PubMed] [Google Scholar]
- [50].Lalwani G, Kwaczala AT, Kanakia S, Patel SC, Judex S, Sitharaman B. Fabrication and Characterization of Three-Dimensional Macroscopic All-Carbon Scaffolds. Carbon N Y. 2013;53:90–100. doi: 10.1016/j.carbon.2012.10.035. [DOI] [PMC free article] [PubMed] [Google Scholar]
- [51].Pittenger MF, Mackay AM, Beck SC, Jaiswal RK, Douglas R, Mosca JD, et al. Multilineage potential of adult human mesenchymal stem cells. Science. 1999;284:143–7. doi: 10.1126/science.284.5411.143. [DOI] [PubMed] [Google Scholar]
- [52].Jaiswal RK, Jaiswal N, Bruder SP, Mbalaviele G, Marshak DR, Pittenger MF. Adult human mesenchymal stem cell differentiation to the osteogenic or adipogenic lineage is regulated by mitogen-activated protein kinase. J Biol Chem. 2000;275:9645–52. doi: 10.1074/jbc.275.13.9645. [DOI] [PubMed] [Google Scholar]
- [53].Raffa V, Ciofani G, Vittorio O, Riggio C, Cuschieri A. Physicochemical properties affecting cellular uptake of carbon nanotubes. Nanomedicine. 2010;5:89–97. doi: 10.2217/nnm.09.95. [DOI] [PubMed] [Google Scholar]
- [54].Rejman J, Oberle V, Zuhorn IS, Hoekstra D. Size-dependent internalization of particles via the pathways of clathrin- and caveolae-mediated endocytosis. Biochem J. 2004;377:159–69. doi: 10.1042/BJ20031253. [DOI] [PMC free article] [PubMed] [Google Scholar]
- [55].Chang Y, Yang S-T, Liu J-H, Dong E, Wang Y, Cao A, et al. In vitro toxicity evaluation of graphene oxide on A549 cells. Toxicol Let. 2011;200:201–10. doi: 10.1016/j.toxlet.2010.11.016. [DOI] [PubMed] [Google Scholar]
- [56].Shvedova AA, Pietroiusti A, Fadeel B, Kagan VE. Mechanisms of carbon nanotube-induced toxicity: Focus on oxidative stress. Toxicol Appl Pharm. 2012;261:121–33. doi: 10.1016/j.taap.2012.03.023. [DOI] [PMC free article] [PubMed] [Google Scholar]
- [57].Liu S, Wei L, Hao L, Fang N, Chang MW, Xu R, et al. Sharper and faster “nano darts” kill more bacteria: a study of antibacterial activity of individually dispersed pristine single-walled carbon nanotube. ACS nano. 2009;3:3891–902. doi: 10.1021/nn901252r. [DOI] [PubMed] [Google Scholar]
- [58].Arvizo RR, Miranda OR, Thompson MA, Pabelick CM, Bhattacharya R, Robertson JD, et al. Effect of nanoparticle surface charge at the plasma membrane and beyond. Nano Lett. 2010;10:2543–8. doi: 10.1021/nl101140t. [DOI] [PMC free article] [PubMed] [Google Scholar]
- [59].Zhang L, Xia J, Zhao Q, Liu L, Zhang Z. Functional graphene oxide as a nanocarrier for controlled loading and targeted delivery of mixed anticancer drugs. Small. 2010;6:537–44. doi: 10.1002/smll.200901680. [DOI] [PubMed] [Google Scholar]
- [60].Cong HP, He JJ, Lu Y, Yu SH. Water-Soluble Magnetic Functionalized Reduced Graphene Oxide Sheets: In situ Synthesis and Magnetic Resonance Imaging Applications. Small. 2010;6:169–73. doi: 10.1002/smll.200901360. [DOI] [PubMed] [Google Scholar]


