Abstract
The thermodynamics and kinetics of the interaction of dihydrofolate reductase (DHFR) with methotrexate have been studied by using fluorescence, stopped-flow, and single-molecule methods. DHFR was modified to permit the covalent addition of a fluorescent molecule, Alexa 488, and a biotin at the N terminus of the molecule. The fluorescent molecule was placed on a protein loop that closes over methotrexate when binding occurs, thus causing a quenching of the fluorescence. The biotin was used to attach the enzyme in an active form to a glass surface for single-molecule studies. The equilibrium dissociation constant for the binding of methotrexate to the enzyme is 9.5 nM. The stopped-flow studies revealed that methotrexate binds to two different conformations of the enzyme, and the association and dissociation rate constants were determined. The single-molecule investigation revealed a conformational change in the enzyme-methotrexate complex that was not observed in the stopped-flow studies. The ensemble averaged rate constants for this conformation change in both directions is about 2–4 s−1 and is attributed to the opening and closing of the enzyme loop over the bound methotrexate. Thus the mechanism of methotrexate binding to DHFR involves multiple steps and protein conformational changes.
Keywords: enzyme mechanisms‖protein dynamics‖fluorescence microscopy
Dihydrofolate reductase (DHFR) catalyzes the reaction of 7,8-dihydrofolate and NADPH to form 5,6,7,8-tetrahydrofolate and NADP+. Tetrahydrofolate is essential for the biosynthesis of purines, thymidylate, and several amino acids. Because of its metabolic importance, DHFR has been extensively studied. The structure of the enzyme from different sources and with different ligands bound has been determined (cf. ref. 1 and references therein). Many steady-state and transient kinetic studies have been carried out, and a detailed mechanism has been developed (cf. ref. 2). At neutral pH, the pathway involves multiple conformational changes, and tetrahydrofolate dissociation occurs after NADPH replaces NADP+ in the ternary complex. The dissociation of tetrahydrofolate is rate limiting at low and neutral pH in the overall catalytic cycle, but at high pH (>8.4), hydride transfer becomes rate limiting. The conformational changes involve domain rotation and interactions with structural loops (cf. refs. 1 and 2). Because of its important metabolic role, DHFR has been a target for anti-cancer drugs. One of these drugs is methotrexate that has a binding dissociation constant in the nanomolar region (3).
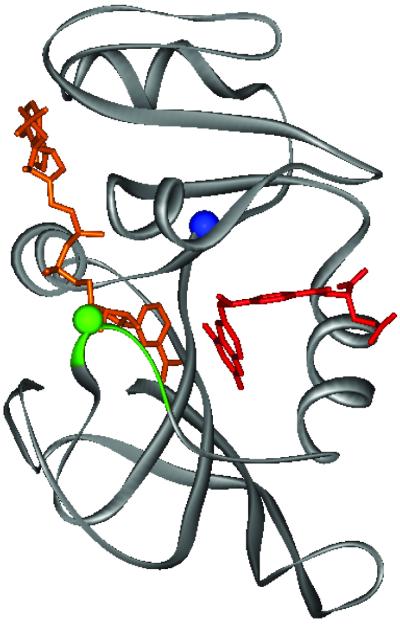
The structure of DHFR from Escherichia coli with methotrexate bound is illustrated in Fig. 1. A loop (amino acid residues 9–24), which can be seen in Fig. 1, closes over the methotrexate when it binds to the enzyme. In this work, a fluorescent label has been introduced by engineering a cysteine residue at position 18 and reacting it with a fluorescent dye, Alexa 488. The reaction of methotrexate with this modified enzyme quenches the fluorescence so that the rate and extent of binding can be measured by monitoring the fluorescence. In addition, biotin was added to an extension of the enzyme at the N terminus to provide a means of attaching the enzyme to a glass slide to study the interaction of methotrexate with the enzyme at the single-molecule level. The rates of binding and ligand dissociation have been determined, as well as an additional conformational change observed in the single-molecule studies.
Figure 1.
Structure of E. coli DHFR with bound NADPH and methotrexate (Protein Data Bank ID code 1rx3). The central portion of the Met-20 loop (residues 17–20) is colored green with the green sphere indicating the location of the Alexa 488 fluorophore (residue 18). The blue sphere represents the N terminus, which is the site of biotinylation. NADPH and methotrexate are colored brown and red, respectively.
Experimental Methods
Construction of Mutant Genes.
The E. coli DHFR gene was first amplified from the pET22b-DHFR plasmid (4) by using primers 5′-GGAATTCGGTACCATGATCAGTCTGATTGCGGC-3′ (forward) and 5′-GCTCGAATTCGGATCCTTAACG-3′ (reverse) and then digested with KpnI and BamHI restriction enzymes. The digested PCR product was ligated into the KpnI and BamHI cleaved pET27b-bioseq vector (gift from Vincent Shier, Pennsylvania State University). The construct thus obtained was used to express E. coli DHFR with a N-terminal, 19-residue (MGLNDIFEAQKIEWHGGGT-DHFR) lysine biotinylation signal sequence (5). Successive QuikChange mutagenesis (Stratagene) steps were then carried out to engineer the following mutations: (i) C152S, 5′-GCAGAACTCGCATAGCTATTCTTTCGAAATCCTCGAGCG-3′ (forward) and 5′-CGCTCGAGGATTTCGAAAGAATAGCTATGCGAGTTCTGC-3′ (reverse); (ii) C85A, 5′-GCCATCGCGGCGGCTGGTGACGTACC-3′ (forward) and 5′-GGTACGTCACCAGCCGCCGCGATGGC-3′ (reverse); and (iii) N18C, 5′-CGCGTTATCGGCATGGAATGCGCCATGCCATGGAACCTGCC-3′ (forward) and 5′-GGCAGGTTCCATGGCATGGCGCATTCCATGCCGATAACGCG-3′ (reverse). The resulting construct, pET27b-bioseq-N18C-C85A-C152S-DHFR was authenticated by nucleic acid sequencing and used for protein expression as follows.
Preparation of Biotinylated and Labeled DHFR.
E. coli BL21(DE3) cells containing the plasmid pET27b-bioseq-N18C-C85A-C152S-DHFR were grown at 37°C in NCZYM medium containing 50 mg/liter kanamycin to an absorbance of ≈0.5 at 600 nm and then induced at 37°C for 5 h with 0.4 mM isopropyl-β-d-thiogalactopyranoside. After harvesting, the bioseq-N18C-C85A-C152S-DHFR protein was purified by using established procedures involving methotrexate affinity and DE-52 anion-exchange chromatography (6). Twenty milligrams of the purified DHFR (≈50 μM in 20 ml) was biotinylated in vitro at 25°C for 24 h in 50 mM potassium phosphate, pH 7.2, containing 1 mM DTT, 4 mM biotin, 5 mM ATP, and 0.5 mg of biotin ligase (BirA-H6). The biotin ligase expression plasmid and the purification procedure were kindly provided by Dorothy Beckett, University of Maryland, College Park (5). The reaction mixture was dialyzed to remove free biotin and DTT, and stoichiometric biotinylation was verified by the Avidin-2-(4′-hydroxyazobenzene)benzoic acid spectrophotometric assay (Pierce). The biotinylated DHFR (≈20 mg) in 18 ml of 50 mM potassium phosphate, pH 7.2, containing 1 mM tri(2carboxyethyl) phosphine hydrochloride and 1% Triton X-100 was then mixed with 2 ml of 4 mg/ml Alexa Fluor 488 C5 maleimide dissolved in dimethylformamide (Molecular Probes). After 24 h incubation at 25°C, the reaction was quenched with 10 mM DTT. The biotinylated and Alexa-labeled DHFR was then purified by methotrexate-affinity chromatography with extensive washing before elution to remove excess Alexa dye and biotin ligase protein. The eluted DHFR was purified from folate by DE-52 anion-exchange chromatography, concentrated, and dialyzed into 50 mM potassium phosphate, pH 7.2, containing 10% glycerol and 1 mM DTT. Aliquots were frozen in liquid nitrogen and stored at −80°C until use. Stoichiometric Alexa labeling was confirmed from absorbance measurements at 492 nm.
Catalytic Properties of DHFR.
Kinetic parameters of the labeled enzyme were determined by previously established procedures (2, 6). All ensemble thermodynamic and kinetic measurements were carried out at 25°C in MTEN buffer (50 mM Mes/25 mM Tris/25 mM ethanolamine/100 mM sodium chloride), pH 7.0. The equilibrium dissociation constants (KD) for dihydrofolate and NADPH binding were determined by the ligand-dependent quenching of intrinsic enzyme tryptophan fluorescence. Whereas the KD for dihydrofolate was unchanged from the WT value of 0.22 μM, NADPH binding (KD = 1.9 μM) was weakened 5.8-fold relative to WT DHFR. The steady-state turnover number (kcat = 6.4 s−1) was determined to be 2.3-fold lower than that of the WT DHFR. Stopped-flow fluorescence was used to ascertain the rate of the hydride transfer chemical step (2). The measured rate of 146 s−1 is 1.5-fold slower than the WT value of 220 s−1. Thus the binding and catalytic properties of the modified enzyme are comparable to those of the WT enzyme.
Methotrexate Binding.
The thermodynamic dissociation constant (KD) for the binding of methotrexate to the modified DHFR was determined by monitoring both the tryptophan (excitation 290 nm, emission 340 nm) and Alexa (excitation 488 nm, emission 514 nm) fluorescence as methotrexate was added to the enzyme in MTEN, pH 7.0, at 25°C. The concentration of enzyme was 48 nM and the methotrexate concentration ranged from 10 to 2,000 nM.
The ensemble kinetics for the association of methotrexate and DHFR were measured with a stopped flow by mixing 1 μM enzyme with 2.5–20 μM methotrexate and monitoring the fluorescence (488-nm excitation, 530-nm cutoff filter emission) in the same buffer and at the same temperature as the dissociation constant measurements.
The rate of dissociation of methotrexate from the complex was measured by reacting 2 μM enzyme with 4 μM methotrexate for a few minutes. The complex was then reacted in the stopped-flow apparatus with either 350 or 700 μM trimethoprim, which replaces methotrexate on the enzyme. The reaction was monitored by following the change in fluorescence as above.
Single-molecule kinetics of enzyme and enzyme-methotrexate were studied with a home-built fluorescence microscope with total internal reflection optics (7). The apparatus used a Zeiss microscope with a ×100, 1.4 aperture, oil immersion lens, and a Pentamax ICCD camera was used to detect the single molecules. The time trajectories of the individual molecules were monitored by shuttered time sequences, typically for the time range 100 ms to 6 s. The half-time for photobleaching was found to be about 30 s. Experiments were performed at ambient temperature, ≈25°C.
The enzyme was attached to the surface of a glass or quartz slide by the following procedure. The slide was first washed extensively with methanol, 1 M NaOH, and 3 M HCl. It was then reacted with 0.1–0.2% 3-aminopropyltrimethoxysilane (Lancaster Synthesis) in hexane for 30 min. This process resulted in a glass surface with exposed amino groups. The presence of amino groups could be ascertained by dipping the slide in picric acid, which produces yellow crystals on the slide (8). The density of amino groups can be controlled with appropriate adjustment of the concentration of silanizing reagent. Approximately 75 μl of 10 mM 6-((biotinoyl)amino)hexanoic acid, succinimidyl ester (Molecular Probes), pH 9.0, 0.1 M sodium phosphate, was then put on the slide, and a coverslip was added after putting two layers of double-sided Scotch tape on the edges of the slide to hold the cover glass in place. Fresh reagent could be added by using capillary action to flow solution between the slide and cover glass. After 1.5 h, picric acid no longer crystallized on the surface, indicating the reagent had reacted and produced a surface with biotin on it. The liquid between the cover glass and slide was replaced with 0.1 M sodium phosphate, pH 7.0. A mixture of 50–100 nM Neutravidin (Molecular Probes), 15 μM BSA, 0.1 M phosphate, pH 7.0, was then put on the slide and allowed to stand for 30 min. The high concentration of serum albumin prevented nonspecific binding of avidin to the slide. This process was repeated three times. A solution of 50–100 nM enzyme, 15 μM BSA, 0.1 M phosphate, pH 7.0 was passed through three times and allowed to stand for 30 min. Finally, either methotrexate in the same buffer or buffer was then passed through three times and allowed to stand for 10 min. This procedure produced a slide with enzyme bound to the surface via a biotin-avidin-biotin sandwich.
In early experiments, the avidin was bound to the slide through nonspecific interactions with a slide that was silanized with 1,1,1,3,3,3-hexamethyldisilizane. Although similar results were obtained for both types of silanization, the early method was much less reproducible in obtaining good fields of single molecules.
The enzymatic activity of the enzyme bound to the slide was ascertained by placing a mixture of 100 μM dihydrofolate and 100 μM NADPH in 0.1 M sodium phosphate, pH 7.0, between the cover glass and slide with bound enzyme. After 10 min, the cover glass was removed and ≈50 μl of the liquid was analyzed by measuring the absorbance at 340 nm and the NADPH fluorescence. Both the absorbance and fluorescence decreased by more than a factor of 2, whereas no changes were observed in the absence of enzyme. Unfortunately, there is no easy way to assess quantitatively the effective concentration of bound enzyme. However, if the bound enzyme concentration is estimated as 10 nM, kcat is about 8 s−1, in reasonable accord with the value obtained from conventional steady-state studies.
Results
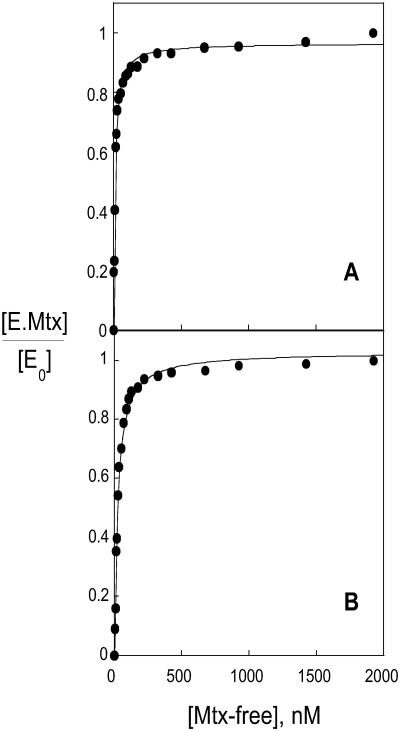
The dissociation constant for methotrexate binding to the modified DHFR was determined by calculating the fraction of enzyme with bound methotrexate, [E.Mtx]/[E0] as the fraction of the total fluorescent change, with the value of the fluorescence at 2.0 μM methotrexate assumed to be that of the enzyme-methotrexate complex. The maximum fluorescence quenching observed was 47% for tryptophan and 50% for Alexa. A plot of the fraction of enzyme with ligand versus the total ligand concentration was used to obtain an estimate of the dissociation constant. This provisional dissociation constant was then used to calculate the unbound methotrexate concentration. A plot of the fraction of enzyme bound with ligand versus the free ligand concentration was then used to obtain a new dissociation constant. This process was repeated until the dissociation constant converged to a final value of 9.5 nM. Plots of the fraction of enzyme with bound ligand versus the free ligand concentration, assuming this dissociation constant, are shown in Fig. 2.
Figure 2.
Fluorescence titration of DHFR with methotrexate. The fraction of bound enzyme, (E.Mtx)/(E0), is plotted versus the free ligand concentration, (Mtx-free). Data were obtained from the fluorescence quenching for both tryptophan (A) and Alexa (B). The curves were calculated by assuming a dissociation binding constant of 9.5 nM.
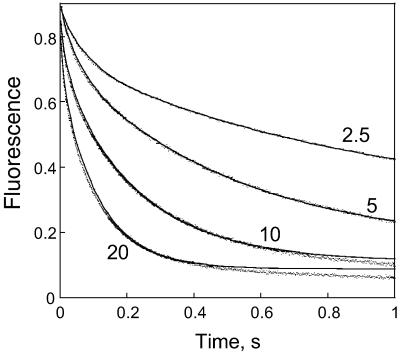
Plots of the change in fluorescence versus time for the reaction of methotrexate are shown in Fig. 3. The data are well fit by assuming a two exponential rate equation:
 |
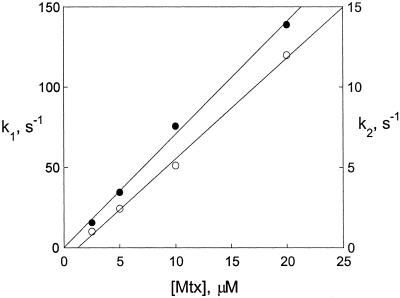
The theoretical fit obtained from a least-squares analysis is included in Fig. 3. The small deviation between the experimental and calculated curves at long times and high methotrexate concentrations is due to the fact that data in which the fluorescence was not significantly varying were not included in the least-squares analysis. Including these data resulted in a poor fitting of the early times. The amplitudes were independent of concentration, with the amplitude of the first process being 22% ± 2% of the total amplitude. The variations of the rate constants with concentration are shown in Fig. 4. The observed variation suggests the binding process involves two second-order reactions with rate constants of 7.03 μM−1⋅s−1 and 0.63 μM−1⋅s−1. (These rate constants are the slopes of the lines in Fig. 4, as obtained from a least-squares fit of the data.)
Figure 3.
Stopped-flow traces for methotrexate binding to DHFR. The fluorescence, in arbitrary units, is plotted versus time, with the concentration of methotrexate (μM) given for each trace. The solid lines represent the least-squares fit of the data.
Figure 4.
The observed first-order rate constants, determined from the data in Fig. 3, for the binding of methotrexate to DHFR are plotted versus the concentration of methotrexate. Here k1 (●) is for the fast phase, and k2 (○) for the slow phase.
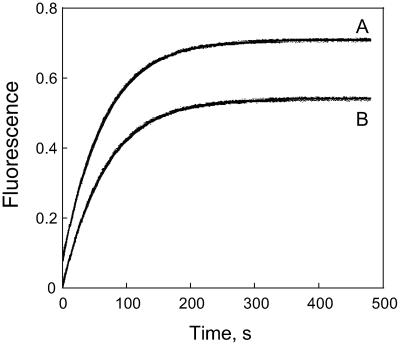
The time dependence for the dissociation of methotrexate from the enzyme complex is shown in Fig. 5 at two different concentrations of trimethoprim. In both cases, the time dependence can be described by a single exponential with a dissociation rate constant of 0.0155 s−1 (0.0158 s−1 and 0.0152 s−1 for 700 and 350 μM trimethoprim, respectively). The fit of the time dependence to the experimental data are included in Fig. 5. The rate of dissociation is independent of the concentration of trimethoprim, indicating that the true rate of dissociation is being measured.
Figure 5.
The time course for the dissociation of methotrexate from the enzyme-methotrexate complex is shown for displacement by 700 μM (A) and 350 μM (B) trimethoprim. The solid lines are calculated by assuming a single exponential increase in fluorescence.
The simplest mechanism consistent with these data makes use of the fact that the DHFR is known to exist in two conformations at pH 7.0 that equilibrate relatively slowly, with an equilibrium constant of about 1 for the WT enzyme (3). The two binding steps observed in the association kinetics can be attributed to binding to the two different forms. The equilibrium ratio of the two forms can be estimated as about 4 from the relative amplitudes of the two bimolecular processes. On the other hand, the dissociation kinetics can be interpreted as the two different conformations of the enzyme-methotrexate complex having the same dissociation constant. These results can be described by the following mechanism: 
The dissociation constant for the top reaction is 2.2 nM and for the bottom reaction is 24.6 nM. Because (E′)/(E) = 4.0, (E.Mtx′)/(E.Mtx) = 0.36. These constants give rise to an overall dissociation constant of 8.1 nM, which is in good agreement with the value of 9.5 nM determined independently.
The above mechanism is consistent with kinetic and equilibrium measurements, independent of the rate of equilibration between E.Mtx and E.Mtx′. If the equilibration is assumed to be rapid relative to the rate of dissociation, the observed dissociation rate constant is a weighted average of the two dissociation rate constants in the mechanism, and a unique fit of the data is not possible. This matter is discussed further below.
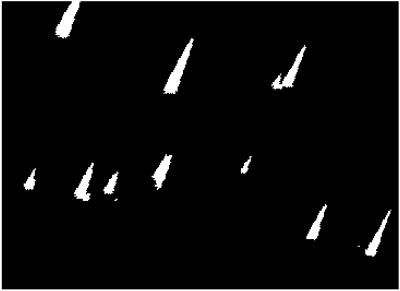
Single molecules of the modified DHFR can be readily seen under the fluorescence microscope. The density of molecules can be controlled by adjusting the concentration of the silanizing reagent and/or the concentration of avidin. A typical field of molecules is shown in Fig. 6. The observed spots follow the behavior expected for single molecules: they all have approximately the same integrated fluorescence intensity and photobleach in an all-or-nothing process that follows an exponential decay. In some cases aggregates can be seen as unusually large spots and/or unusually high intensities. The signal-to-noise ratio ranged from about 1.5 to 2.5.
Figure 6.
Three-dimensional representation of single molecules of DHFR (0.1 M sodium phosphate, pH 7.0, ≈25°C) as viewed by fluorescence microscopy. The vertical dimension is the fluorescence intensity in arbitrary units. National Institutes of Health image software was used to generate this plot. (Magnification: ×100.)
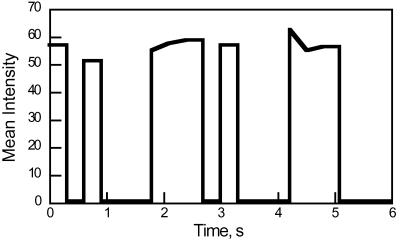
The single-molecule fields were analyzed with the National Institutes of Health image program. This program permits the subtraction of a background and determines the intensity of the remaining individual spots (single molecules). The time evolution of individual spots was then plotted. A typical trajectory (time evolution) is shown in Fig. 7. A “blinking” of the spots can be seen in the presence of methotrexate, but not in its absence. The uncertainty/variation in the measured intensities is ≈30%. The distribution of time constants can be measured for both the disappearance and appearance of spots. It should be noted that the term “disappearance” is inappropriate. The background is adjusted to eliminate the dim spots, thus creating the illusion of an all or nothing process. If the amount of background subtracted is decreased, it can be seen that the quenching is about 50%.
Figure 7.
Representative trajectory for the blinking of single molecules of the DHFR-methotrexate complex. The fluorescence intensity, in arbitrary units, is plotted versus the time. The free methotrexate concentration was 5 nM.
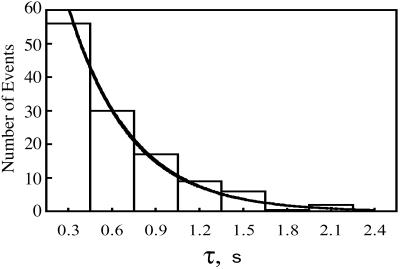
The reaction times for individual molecules were tabulated for a minimum of 100 events at each methotrexate concentration. The events were then sorted into ranges of lifetimes to give the distribution for the number of events occurring for each range of lifetimes. A typical distribution of reaction time constants is shown in Fig. 8. As expected, at low methotrexate concentrations, 5–10 nM, only about one-half of the molecules displayed the blinking behavior, whereas at high methotrexate concentrations, >25 nM, virtually all of the molecules blinked. Because the single molecule reaction is seen only in the presence of methotrexate, the logical assumption is that the single-molecule quenching process is seen only in the methotrexate-enzyme complex. The process can be represented as
 |
where kf and kr are the ensemble averaged rate constants. The distribution of reaction times for the loss of the high intensity state, A, is (9)
 |
where NA(τ) is the number of events with a lifetime τ and NA(0) is the total number of events. Similarly the distribution of lifetimes for the low intensity state, B, is given by
 |
Thus the distributions of lifetimes are described by a single exponential function from which the ensemble averaged rate constants can be obtained. An exponential fit of the data is included in Fig. 8. A summary of the ensemble averaged rate constants at various methotrexate concentrations is given in Table 1. The uncertainty in these values is about 25%, primarily due to the limited number of events and limited time resolution of the equipment. The rate constants do not vary significantly as the concentration of methotrexate is increased.
Figure 8.
Representative distribution of single-molecule reaction times for the transition from the low intensity state to the high intensity state. The number of events within a given range of reaction times is shown as a series of rectangles and plotted versus the reaction time, τ. The line assumes a single exponential distribution as described in the text. The free methotrexate concentration was 5 nM.
Table 1.
Ensemble average rate constants for E.Mtx
| Mtx, nM | kr, s−1 | kf, s−1 |
|---|---|---|
| 5 | 2.0 | 2.2 |
| 10 | 1.5 | 1.6 |
| 25 | 2.8 | 2.0 |
| 100 | 4.2 | 4.4 |
Obtained from single molecule measurements at pH 7.0, 0.1 M sodium phosphate, ∼25°C.
Discussion
The results obtained in this work show that the binding of methotrexate to DHFR is a complex process, involving multiple enzyme conformations. Moreover, the single-molecule studies reveal a conformational change not found in the stopped-flow investigation. The kinetic process seen in the single-molecule studies cannot be directly caused by the association-dissociation process because the rate constant for dissociation is much less than the rate constants in Table 1, and the rate of association increases directly proportional to the methotrexate concentration. The conformational change probably involves an opening and closing of the loop over the methotrexate, with fluorescence quenching occurring when the loop closes and Alexa moves closer to methotrexate. The equilibrium constant for the reaction is about 1, as suggested by the rate constants and the fact that approximately an equal number of events are observed for the quenching and appearance of fluorescence. Although this conformational transition was not seen in the stopped-flow work, it should be noted that a conformational change within the folate-DHFR complex with a characteristic time constant of about 20 s−1 has been inferred from NMR measurements (10).
The conformational transition may be the interconversion of E.Mtx and E.Mtx′. The equilibrium constant for this transition was estimated as 0.4 from the stopped-flow studies, but this estimate assumes that both conformers of the enzyme-methotrexate complex have the same dissociation rate constant. If the assumption is made that (E.Mtx′)/(E.Mtx) = 1, as suggested by the single-molecule results, and the rate of interconversion of the two conformers is rapid relative to the rate of ligand dissociation, the ligand dissociation rate constants for E.Mtx and E.Mtx′ calculated from the observed dissociation rate constant are 0.023 s−1 and 0.0082 s−1, respectively. The overall equilibrium dissociation constant is 8 nM. Thus this mechanistic possibility is consistent with all of the data. It should be noted, however, that the rate constants for the interconversion of E and E′ for the WT enzyme have been estimated to be about 3 × 10⁻² s−1, much smaller than observed in the single-molecule studies (3). The binding of methotrexate to the WT enzyme also involves binding to both E and E′ (3).
With the mutant enzyme developed for this work, a fluorescent probe can be placed at various positions in the molecule by inserting a cysteine. This will permit monitoring of multiple regions of the enzyme during catalysis and binding reactions. In addition, a method was developed for attaching active enzyme to the glass surface that should be useful for many systems. This method permits easy modulation of the density of single molecules and should provide an identical environment for all enzyme molecules, thus eliminating artifacts that can arise because of sample heterogeneity. Importantly, the enzyme attached to the slide is catalytically active.
The methotrexate-enzyme system was developed as a preliminary step to studying the single-molecule kinetics of the enzymatic reaction. For this model reaction, the slow dissociation of ligand ensures that only processes within the enzyme-methotrexate complex are observed. The unique conformational change found provides further evidence that single-molecule kinetics will be useful in revealing new information about the dynamics of enzyme catalysis (cf. refs. 9, 11, and 12).
Acknowledgments
This work was supported by Petroleum Research Foundation Grant 3575-AC4 (to G.G.H.) and National Institutes of Health Grants GM 65128 (to G.G.H.) and GM 24129 (to S.J.B.).
Abbreviation
- DHFR
dihydrofolate reductase
References
- 1.Sawaya M R, Kraut J. Biochemistry. 1997;36:586–603. doi: 10.1021/bi962337c. [DOI] [PubMed] [Google Scholar]
- 2.Fierke C A, Johnson K A, Benkovic S J. Biochemistry. 1987;26:4085–4092. doi: 10.1021/bi00387a052. [DOI] [PubMed] [Google Scholar]
- 3.Cayley P J, Dunn S M J, King R W. Biochemistry. 1981;20:874–879. doi: 10.1021/bi00507a034. [DOI] [PubMed] [Google Scholar]
- 4.Cameron C E, Benkovic S J. Biochemistry. 1997;36:15792–15800. doi: 10.1021/bi9716231. [DOI] [PubMed] [Google Scholar]
- 5.Beckett D, Kovaleva E, Schatz P J. Protein Sci. 1999;8:921–929. doi: 10.1110/ps.8.4.921. [DOI] [PMC free article] [PubMed] [Google Scholar]
- 6.Miller G P, Wahnon D C, Benkovic S J. Biochemistry. 2001;40:867–875. doi: 10.1021/bi001608n. [DOI] [PubMed] [Google Scholar]
- 7.Axelrod D. Methods Cell Biol. 1989;30:245–270. doi: 10.1016/s0091-679x(08)60982-6. [DOI] [PubMed] [Google Scholar]
- 8.Jia Y, Talaga D S, Lau W L, Lu H S M, DeGrado W F, Hochstrasser R M. Chem Phys. 1999;247:69–83. [Google Scholar]
- 9.Xie X S, Lu H P. J Biol Chem. 1999;274:15967–15970. doi: 10.1074/jbc.274.23.15967. [DOI] [PubMed] [Google Scholar]
- 10.Kitahara R, Sareth S, Yamada H, Ohamae E, Gekko K, Akasaka K. Biochemistry. 2000;39:12789–12795. doi: 10.1021/bi0009993. [DOI] [PubMed] [Google Scholar]
- 11.Ha T, Ting A Y, Liang J, Caldwell W B, Deniz A A, Chemla D S, Schultz P G, Weiss S. Proc Natl Acad Sci USA. 1999;96:893–898. doi: 10.1073/pnas.96.3.893. [DOI] [PMC free article] [PubMed] [Google Scholar]
- 12.Zhang X, Bartley L E, Babcock H P, Russell R, Hu T, Herschlag D, Chu S. Science. 2000;288:2048–2051. doi: 10.1126/science.288.5473.2048. [DOI] [PubMed] [Google Scholar]


