Abstract
Spatial super-resolution in thermophotonic imaging was achieved using a combination of spatial second-derivative forming, spatial gradient adaptive filtering, and Richardson-Lucy deconvolution in conjunction with the construction of an experimental point spread function. When implemented through enhanced truncation-correlation photothermal coherence tomography (eTC-PCT), it was possible to restore blurred infrared thermophotonic images to their prediffusion optical resolution state. This modality was tested in various biological applications and proved to be capable of imaging fine axial cracks in human teeth, well-patterned anatomical subsurface structures of a mouse brain, and neovascularization in a mouse thigh due to the rapid proliferation of cancer cells. This modality was found to be immune to optical scattering and could reveal the true spatial extent of biological features at subsurface depths that conventional thermal imaging cannot reach because of limitations imposed by the physics of spreading diffusion.
The breakthrough modality overcomes traditional thermopotonic imaging limitations in resolution and depth due to heat diffusion.
INTRODUCTION
Modern photothermal techniques are under intense development for providing air-coupled, fast, optical-to-thermal energy conversion modalities for molecular (1), spectroscopic (2), and nondestructive (3, 4) imaging applications through the use of nonscanning multi-array infrared (IR) camera imagers coupled with ultrafast (speed-of-light) transmission of thermal IR photons (radiative emission channel). The recent development of thermophotonic modalities such as truncated correlation photothermal coherence tomography (TC-PCT) (5) and its enhanced version (eTC-PCT) (6) has the ability to produce depth-resolved tomographic images and three-dimensional (3D) mapping of biological hard and soft tissues. In dental imaging applications, eTC-PCT has shown 3D visualization and the subsurface extent of a variety of dental defects validated by micro–computed tomography (μCT), a nondestructive laboratory gold standard method for the measurement of dental flaws and demineralization caries (7–10). These proof-of-concept studies demonstrated that eTC-PCT has the potential to provide dental practitioners not only with tools for detecting caries but also for detecting cracks before a large portion of a tooth fractures off, in their future clinical applications. However, because of the foregoing spatial resolution limitations, the diffusion of thermally converted optical energy spreads and increases the effective size of features from inner slices leading to spatial resolution and contrast reduction proportional to the depth of the source below the surface (11). Therefore, the imaging modality needs to deal with the well-known major physical limitation of photothermal imaging due to thermal-wave lateral and axial diffusion that tends to blur tomographic images (12, 13), leading to spatial resolution deterioration.
Here, a method to overcome the physics of lateral thermal diffusion in photothermal IR-photon–mediated (thermophotonic) tomographic imaging that has greatly limited the use of thermal imaging to date was developed using a spatial second-derivative algorithm, combined with a modified spatiotemporal gradient adaptive filter, an experimentally developed point spread function (PSF) of the IR camera for optimized diffusive image restoration (Richardson-Lucy deconvolution). The PSF-mediated deconvolution corrects diffusion spread by reversing the effect of convolution. The spatial second-derivative formation enhances the regions of higher absorbance in the eTC-PCT images. The spatial gradient adaptive filter at fixed delay times acts as a spatiotemporal derivative operation filter that produces a peak when the spatial width of the window matches the steepest lateral gradient of signals broadened by sideways diffusion from absorber boundaries. A combination of these operations was applied to the conventional eTC-PCT images, and the results show that it restores the image resolution very close to the prediffusion optical resolution enhanced by thermal conversion immune to optical scattering. Our study on the highly optically scattering biological tissues shows that the unique combination of thermophotonic optical-grade restoration methods and rapid camera charge-coupled device or complementary metal-oxide semiconductor full pixel array image processing reveals the true spatial extent of a hairline dental enamel crack, resolves finely patterned anatomical structures of a mouse brain in vivo and ex vivo, and monitors cancerous tumor growth in vivo in a mouse thigh after cancer cell injection. These are distinct advantages over conventional optical methods, which cannot operate subsurface because of the high light scattering nature of soft and hard tissues, while photoacoustic and ultrasonic imaging imposes requirements for coupling media such as water or gel with complicated, time consuming, and expensive transducer array (detector) scanning for 2D and tomographic rotation for 3D image acquisition.
RESULTS
Principle of eTC-PCT imaging modality
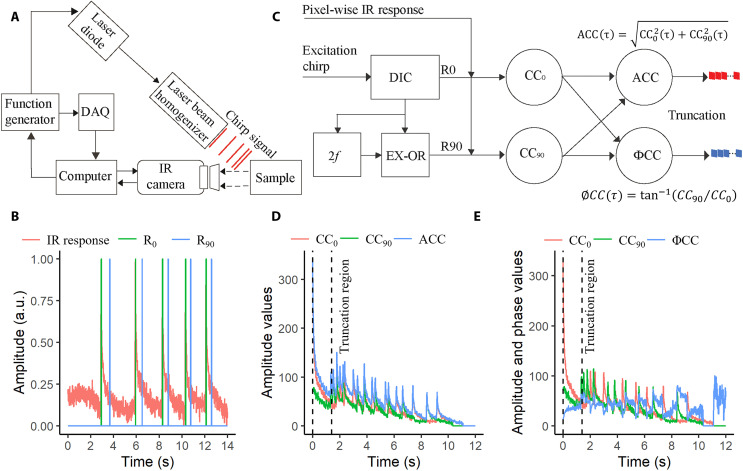
In eTC-PCT imaging modality (6), a linear frequency-modulated chirp of short optical pulses is introduced on the surface of a sample, and the IR responses emitted by the sample through an IR camera are monitored as shown in Fig. 1A. The in-phase (R0) and quadrature (R90) reference signals, which are synthesized from the excitation chirp and the IR response at a specific pixel location using a pulse chirp with frequency sweep range of 0.2 to 0.6 Hz, duration of 12 s, pulse duration of 40 ms, and wavelength of 808 nm as shown in Fig. 1B, are cross-correlated at each pixel location. The resulting time delay measurement determines the depth of the absorber, as illustrated schematically in eTC-PCT signal processing diagram (Fig. 1C). The cross-correlation of R0 and R90 reference signals with the IR signal is depicted in Fig. 1 (D and E, respectively). The amplitude cross-correlation (ACC) and phase cross-correlation (ØCC) responses were calculated using equations provided in Fig. 1C. The final correlation responses (ACC and ØCC) were then truncated at consecutive time intervals by a time-gating filter to extract depth-resolved amplitude and phase information. The truncation region is shown in Fig. 1 (D and E) determined by the number of camera frames available between the quadrature component of the (n − 1)th pulse and the in-phase component of the nth pulse, where n is the number of the excitation pulse (6). The responses outside the truncation region were discarded, as they contain higher harmonic components. The width of the gated interval (d) can be adjusted up to dmin (=1/fs), where fs is the sampling frequency of IR camera (104 Hz). The data combined from all pixel locations at a specific time interval lead to tomographic amplitude and phase slice images (2D) of the sample. Amplitude and phase channels at the same pixel and delay time were combined (cross-multiplied) to obtain a new output for each delayed slice as our experimental results showed that the combined channel features higher spatial resolution and dynamic range than either channel alone, revealing more detailed structures of biological samples such as small vascular capillaries (14). This was done in analogy to photoacoustic frequency-domain imaging, which also showed that the amplitude provides increased SNR, while the phase exhibits higher spatial resolution (15). These combined amplitude and phase output images from each slice were adopted throughout the optimization of eTC-PCT images. A deconvolution method based on experimentally calculated PSF (text S1) followed by spatial second-derivative formation (text S2) and a unique spatial gradient adaptive filter (text S3) was applied to reconstruct thermophotonic super-resolution tomography images.
Fig. 1. The fundamental concept behind the signal processing of eTC-PCT.
(A) Schematic illustration of experimental set up of eTC-PCT system. (B) The IR response is shown along with its corresponding in phase (R0) and quadrature (R90) references, derived from arbitrary experimental data. The experiment used a chirp with a frequency sweep range of 0.2 to 0.6 Hz, a duration of 12 s, pulse durations (width) of 40 ms, and a wavelength of 808 nm. Camera frames were recorded for 14 s (2 s more than the chirp) at 104 Hz. (C) Pixel-wise signal processing flow diagram for the eTC-PCT algorithm. DIC, 2f, EX-OR, and CC refer to delay incremental unit, frequency (f) doubler, exclusive-OR logical operator, and cross-correlation, respectively. (D) In-phase (CC0), quadrature (CC90), and amplitude (ACC) cross-correlation data. (E) In-phase (CC0), quadrature (CC90), and phase (ΦCC) cross-correlation data. The dashed black vertical lines in (D) and (E) indicate the truncation region, outside of which, the responses are discarded as they contain higher harmonic components.
Imaging of hairline dental crack in extracted human tooth
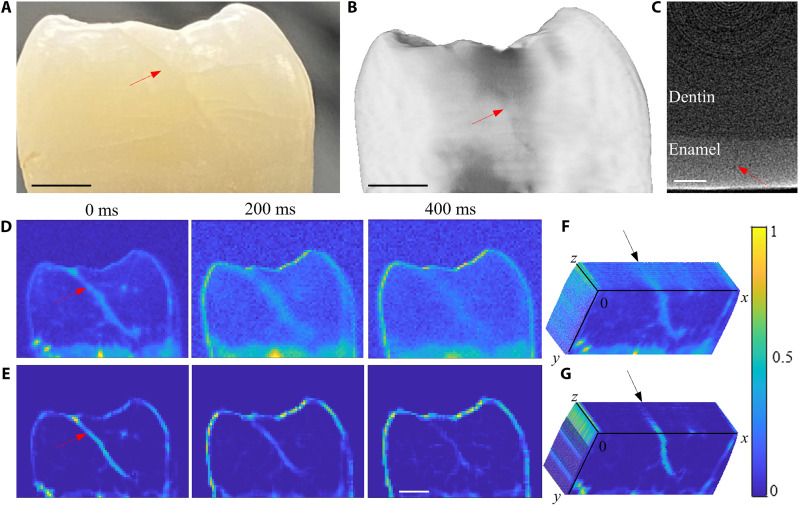
An anonymous extracted human tooth with a hairline crack on the mesial area of the tooth (shown by a red arrow in Fig. 2A) was selected. The crack was found to be of a relatively uniform width of 100 μm across the tooth. This was further confirmed using μCT (Fig. 2B). The depth of the crack is shown in the tomography image (Fig. 2C), which shows that the crack is extended along much of the enamel surface. Depths of the cracks were estimated at distances 0, 346, and 489 μm from the surface using Eq. 1 provided in Materials and Methods corresponding to delay times 0, 200, and 400 ms, respectively. Figure 2D shows conventional eTC-PCT images. Because of the diffuse nature of heat conduction in enamel, the resolution of the crack degrades rapidly with distance and time from the surface of the tooth. As can be seen in the 200- to 400-ms delay time images, the crack is diffused in the lateral direction and the contrast is substantially degraded. However, the size of the deep crack is almost the same in the μCT slice (Fig. 2C). The eTC-PCT images after applying the PSF-mediated Richardson-Lucy deconvolution, second-derivative, and spatial gradient adaptive filter are shown in Fig. 2E. The process reversed the lateral diffusion and extensively improved the spatial resolution of the crack. The deep crack (400-ms delay time), which deteriorated in the conventional eTC-PCT image (Fig. 2D), is clearly visible in the filtered image (Fig. 2E).
Fig. 2. Results of diffusion correction in hairline dental crack.
(A) A photograph of the tooth with a crack shown by the red arrow. Scale bar, 2 mm. (B) Reconstructed μCT image. Scale bar, 2 mm. (C) MicroCT slice of the tooth showing the depth of the crack in (B). Scale bar, 0.5 mm. (D) Conventional eTC-PCT images at delay times of 0, 200, and 400 ms. The color bars on these images do not have units (expressed in arbitrary units), as they were generated by combining amplitude and phase images through cross-multiplication. (E) eTC-PCT images in (D) after applying deconvolution, second-derivative, and spatial filtering algorithms. Scale bar, 2 mm. Angled cross section of the 3D volume from conventional eTC-PCT images (F) and filtered eTC-PCT images (G).
The extracted two-dimensional eTC-PCT slices were processed by ImageJ software to generate 3D volume reconstruction (16). Figure 2 (F and G) present the transverse cross section of the 3D volume images from the original eTC-PCT tomograms and the processed eTC-PCT datasets, respectively. The transverse cross-sectional image of eTC-PCT channels (Fig. 2F) shows that the crack is diffused inside the tooth, and it is almost impossible to determine its extent, whereas the transverse cross-sectional image of filtered eTC-PCT channels (Fig. 2G) shows that the crack is extended inside the tooth over the cross section down to a depth of 0.6 mm from the surface of the tooth (black arrow in Fig. 2G). These results show that the 3D reconstruction of teeth from the diffusion-corrected tomographic slices provides greatly improved visualization of the boundaries of the crack while its extent inside the tooth can be observed in a transverse plane across the tooth very similar to the μCT image (Fig. 2C) but with much better contrast.
In vivo imaging of mouse brain
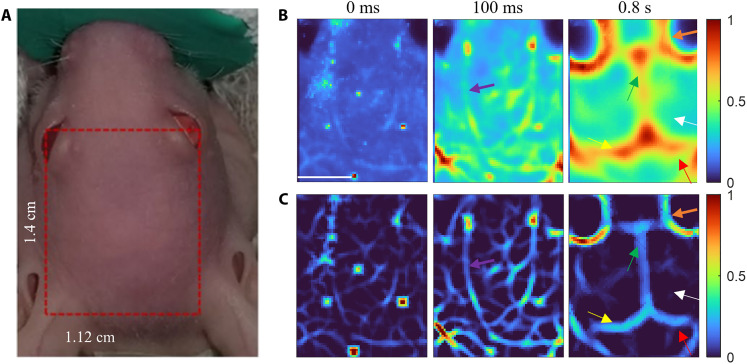
In vivo eTC-PCT imaging of a mouse brain was performed by placing the mouse under anesthesia. Figure 3A shows a photograph of a mouse head; the imaged region of interest is shown by the red rectangle. The conventional eTC-PCT images were deteriorated largely by the diffusive spread as shown in delay times 0 ms, 100 ms, and 0.8 s (Fig. 3B). As expected, the near-subsurface eTC-PCT images (0 and 100 ms) are much less blurred compared to the deeper image (0.8 s). Therefore, deconvolution and second-derivative algorithms were sufficient for restoring the true spatial content of the biological features, such as near-subsurface blood vessels. With combined deconvolution and second-derivative processing, the near-subsurface blood vessel network (purple arrows at 100 ms) that appeared lumped or could hardly be distinguished in the original eTC-PCT images can now be clearly resolved in the 0- to 100-ms delay time slices (Fig. 3C). These small blood vessels disappeared in deeper slices and only large blood vessels (orange arrows) could be observed at 0.8-s delay time (Fig. 3C). Such deep subsurface features became visible only by applying deconvolution followed by spatial second-derivative and spatial adaptive filtering. The other brain anatomical features, such as cerebrum (white arrow), hemisphere of cerebellum (red arrow), superior sagittal sinus (green arrow), and transverse sinus (yellow arrows) are distinctly visible in the diffusion-corrected image at 0.8-s delay time (Fig. 3C).
Fig. 3. Outcomes of diffusion correction in live mouse brain imaging.
(A) A photograph of a mouse head under the anesthetic machine. The imaged area on the mouse head is shown in the red rectangle. (B) Conventional eTC-PCT slices at delay times of 0 ms, 100 ms, and 0.8 s. Scale bar, 5 mm. (C) eTC-PCT images after deconvolution and second-derivative analysis at delay times of 0 and 100 ms, as well as after applying all three algorithms at a delay time of 0.8 s. The purple, orange, white, red, green, and yellow arrows indicate small blood vessels, large blood vessels, cerebrum, hemisphere of cerebellum, superior sagittal sinus, and transverse sinus, respectively. The color bar details are as for Fig. 2.
Ex vivo imaging of mouse brain
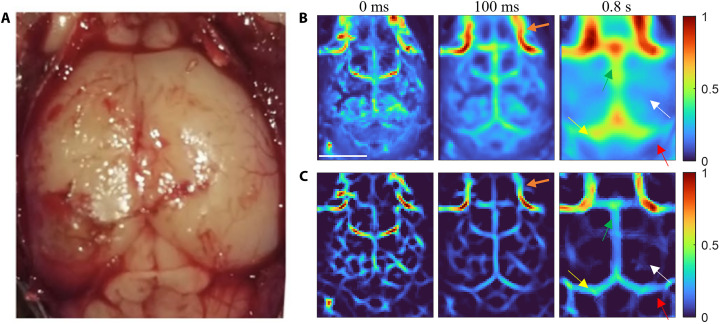
eTC-PCT imaging of the mouse brain was subsequently performed ex vivo after the removal of the scalp of the euthanized mouse. Figure 4A shows an open-skull photograph of the cortex vasculature. The conventional eTC-PCT images at 0-ms, 100-ms, and 0.8-s delay times are depicted in Fig. 4B. The diffusion-reversal process yielded the blur suppressed/high-contrast images shown in Fig. 4C after the implementation of deconvolution and second-derivative processing of the near-surface slices (0- and 100-ms delay times) and all three algorithms on the deeper slice (0.8-s delay time). It is interesting to note that the blood vessel network in Fig. 3C, associated with the skin of the skull (0- to 100-ms delay times), is not present in this open-skull image sequence shown in Fig. 4C. The remaining features are similar to the in vivo depth selective images of the mouse brain: the interior blood vessels (orange arrow), cerebrum (white arrow), hemisphere of cerebellum (red arrow), superior sagittal sinus (green arrow), and transverse sinus (yellow arrow) became visible within a 100-ms delay time, although they were notably distinct at 0.8-s delay time. In Fig. 4, individual structures appear from various subsurface layers at shorter (by ~50%) delay times than in Fig. 3, owing to the open-skull inspection with no skin and bone interfaces to act like thermal delay lines. None of the interior brain structures can be seen in the visible light photograph in Fig. 4A.
Fig. 4. Results of using diffusion correction in ex vivo mouse brain imaging.
(A) Ex vivo open-skull photograph of the cortex vasculature. (B) eTC-PCT slices at delay times of 0 ms, 100 ms, and 0.8 s. Scale bar, 5 mm. (C) eTC-PCT images after deconvolution and second-derivative analysis at delay times of 0 and 100 ms, and after applying all three algorithms at a delay time of 0.8 s. The orange, white, red, green, and yellow arrows indicate blood vessels, cerebrum, hemisphere of cerebellum, superior sagittal sinus, and transverse sinus, respectively. The color bar details are as for Fig. 2.
In vivo monitoring of tumor in mouse thigh
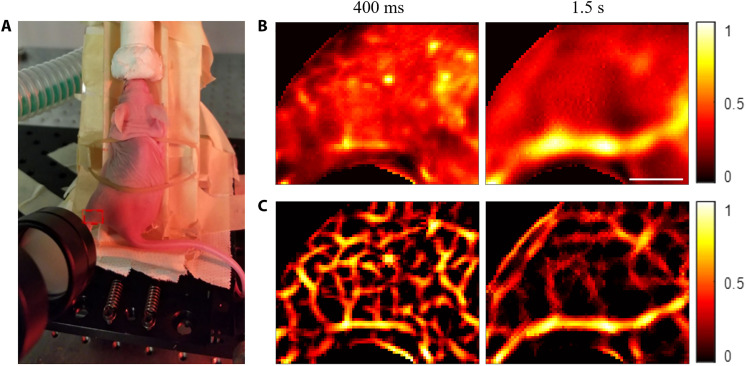
In vivo eTC-PCT imaging of a healthy mouse’s thigh was acquired by placing the mouse under anesthesia, as shown in the photograph (Fig. 5A). The red rectangle on the mouse’s thigh indicates the imaged area. The conventional eTC-PCT images at 400-ms and 1.5-s delay times are shown in Fig. 5B. These two images provide different depth information of the mouse thigh: The former provides the small saphenous veins/arteries, while the latter predominantly images the great saphenous vein, a large vein of the legs and thigh. The blood vessels are visible in the eTC-PCT images, as they provide higher photothermal signals compared to the surrounding tissues because of the increased absorption coefficient of hemoglobin. The small blood vessels (400-ms delay) are much more prominent in the eTC-PCT images after applying deconvolution and second-derivative processing (Fig. 5C). Similarly, the true spatial content of the great saphenous vein (1.5-s delay) was achieved by applying deconvolution followed by spatial second-derivative and spatial adaptive filtering.
Fig. 5. Diffusion correction results in in vivo imaging of a healthy mouse thigh.
(A) A photograph of the anesthetized mouse placed on the holder for eTC-PCT imaging. The red dashed rectangle on the mouse thigh indicates the imaged area. (B) Conventional eTC-PCT slices at 400-ms and 1.5-s delay times. Scale bar, 5 mm. (C) eTC-PCT images after deconvolution and second derivative at a 400-ms delay time and after applying all three algorithms at a 1.5-s delay time. The color bar details are as for Fig. 2.
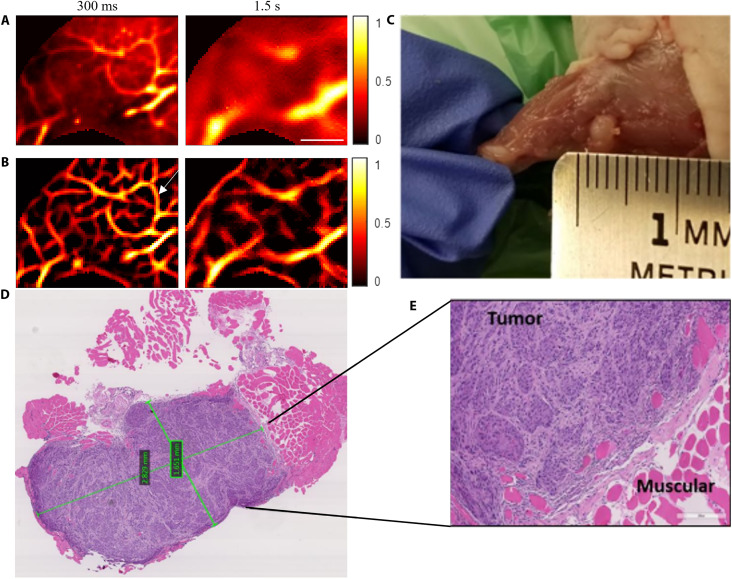
The eTC-PCT imaging of the anesthetized mouse thigh was subsequently performed after injecting cancer cells. Figure 6 presents the results on the ninth day after the injection of cancer cells. The conventional eTC-PCT images at 300-ms and 1.5-s delay times are shown in Fig. 6A, while the eTC-PCT image after deconvolution and the second derivative at 300-ms delay time and after applying all three algorithms at 1.5-s delay time are shown in Fig. 6B. The eTC-PCT images at 300-ms delay time show the formation of new blood vessels (angiogenesis) in the form of a “vessel ring” surrounding the injection location to support the rapid proliferation of cancer cells. This is a critical indicator of the onset of cancerous lesion growth. The vasculature network around the tumor becomes much more visible because of enhanced contrast against the blood-deficient background after the implementation of deconvolution and second derivative on the conventional eTC-PCT image (Fig. 6B). The formation of new blood vessels and their connections with the existing vessels are not visible in the deeper slices (after 1.5-s delay time; Fig. 6B), which predominantly show the blood-rich great saphenous vein. Nevertheless, the contrast and spatial resolution of the great saphenous vein have been greatly improved, and the true spatial extent of the vein and surrounding vessels, which had been obliterated from the original diffusive image, has been restored following spatiotemporal filtering.
Fig. 6. Results of applying diffusion correction in in vivo imaging of a mouse thigh with cancer.
(A) Conventional eTC-PCT slices at 300-ms and 1.5-s delay times, showing the features at different depths in the mouse thigh after 9 days of cancerous cell injection. Scale bar, 5 mm. (B) eTC-PCT images after deconvolution and second derivative at a 300-ms delay time and after applying all three algorithms at a 1.5-s delay time. (C) Visible-light photograph of the tumorous area after euthanizing the mouse and removing the leg skin. (D and E) Microscopic H&E images of the tumor tissues. The tumorous tissue reveals a high density of cancer cells that have purplish blue nuclei, while the normal tissue is seen as the pink/red areas. The two green quadrangles in the middle of the tumor (D) indicate the in-software measured sizes. The color bar details are as for Fig. 2.
After producing the eTC-PCT images on the ninth day of injection, the mouse was euthanized, and the leg skin was removed. Figure 6C shows the visible light photograph of the skinless mouse thigh. The tumor is clearly visible in the photograph after skin removal. To further confirm the presence of a tumor, the tumorous tissues were extracted and sent for histological imaging. Figure 6 (D and E) shows the hematoxylin and eosin (H&E) images of the tumor cells of uniform appearance characteristically arranged in nests and covered by fibrous bands. The surrounding normal tissues, which are pink/red in color, showed eosinophilic hyaline staining (Fig. 6E). The two green quadrangles in the middle of the tumor (Fig. 6D) indicate the in-software measured sizes. The size of the tumor measured with the software was 2.8 mm by 1.6 mm. The geometry of the tumor cell in the H&E staining (purplish blue color in Fig. 6D) is consistent with the visible light photograph of the tumorous thigh (Fig. 6C).
DISCUSSION
Natural teeth often exhibit hairline cracks in the dental enamel running along the long axis of the tooth (17–19). Studies show that these microfractures may not show up on bitewing radiographs (18, 19). This implies a possible thermophotonic imaging advantage within the oral cavity due to the inability of radiographs to produce tomographic images without angular scanning, unlike the 2D eTC-PCT planar slice tomograms. In eTC-PCT, enhanced photothermal signal contrast occurs at the dental sample upon external excitation primarily due to the presence of geometric discontinuities in the cracked region, which occur along the actual crack edges generating imaging contrast due to thermal-wave confinement and localization. Therefore, the processed images are directly representative of the actual extent, boundaries, and volume of the crack. These tomographic sliced data after diffusion reversal (Fig. 2E) facilitate the determination of the true size and shape of a dental enamel crack, and stacking up of the tomographic slices produces a realistic 3D visualization of the crack, where the severity of the defect is determined by the strength of the thermophotonic eTC-PCT signal.
The near-subsurface blood vessels within the mouse skin and skull overlayers were not finely resolved even in the earliest images at 0- to 100-ms delay time (Fig. 3B) in the conventional eTC-PCT. Similarly, the deep surface features, such as superior sagittal sinus, and transverse sinus at 0.8-s delay time (Fig. 3B) were distorted by the diffusion spread, and the contrast with other brain tissues was minimal. The diffusion-suppressed images (Fig. 3C) reveal blood vessels and vascular distribution in the brain at different depths with high thermophotonic (combined optical and thermophysical) contrast. Substantial resolution improvement was observed in the eTC-PCT images with skin (Fig. 3C) where imaging features lay beneath the dense and light-scattering skull overlayer of the mouse brain. This is because the skin/skull profusely scattered the incident laser beam and induced a stronger lateral thermal diffusion to the back-propagating thermophotonic response. As a result, notable resolution improvement was observed in the processed in vivo eTC-PCT images of the mouse brain resolving small near-surface brain vessels at 0 to 100 ms and all subsequent delay times.
The diffusion correction methods developed in this work can substantially improve the sensitivity of the eTC-PCT imaging modalities for visualizing the early indications of tumors and facilitating the detection and management of cancer when it is at the most treatable stage. Tumor cells require more nutrients and oxygen compared to healthy normal cells to grow and survive; as a result, a dense vascular network is developed around the tumor cells (angiogenesis) (20). The vessel “ring” shown by the white arrow in the postinjection vessel network image (Fig. 6B) is absent in the preinjection vessel network image (Fig. 5C). The ring and the vessels that connect the ring to the existing vasculature appear very clearly in the postinjection diffusion-corrected image (Fig. 6B). These improvements are highly desirable for the clinical diagnosis of early-stage tumors.
In conclusion, super-resolution thermophotonic imaging promises to become a noninvasive air-coupled modality for tomographic visualization and 3D mapping of biological hard and soft tissues. Advantages include superior spatiotemporal resolution compared to other thermal and thermographic imaging modalities and 3D visualization of the sample. Thermophotonic methods are inherently molecularly specific. The benefit of these detection methods, in contrast to conventional optical sensing methods that rely on the detection of backscattered/reflected/transmitted light from structural inhomogeneities, is their enhanced detection specificity and greatly extended signal dynamic range (21). Another key aspect of this imaging modality is speed, a consequence of radiative heat transfer: It can scan a tooth in 12 s and the entire mouse head in less than 80 s.
MATERIALS AND METHODS
Dental sample preparation and eTC-PCT imaging
Anonymous extracted human teeth were collected from local oral surgeons in Toronto following the ethical guidelines in place at the University of Toronto (protocol number 00041610). The collected teeth were subsequently cleaned, visually inspected, and kept in a tightly capped container containing 0.1% thymol solution. For the experiments, a tooth with a hairline crack was selected. The tooth was washed off in running water, dried in the air, and mounted on a LEGO block to ensure repeatable and accurate positioning of the sample while taking eTC-PCT images. To produce thermophotonic images, raw camera frames (sampling frequency, f = 104 Hz) were collected from the eTC-PCT system with a fixed-width excitation pulse in the frequency range between 0.2 and 0.6 Hz, a chirp duration of 12 s, and pulse duration of the excitation chirp of 40 ms. The energy density on the sample surface was 0.66 J/cm2. This value complies with the maximum permissible exposure (MPE) requirements (22), operating at 82% of the allowable maximum energy for clinical uses. After the eTC-PCT signal processing, tomographic images of size 80 × 64 pixels were generated at 20-ms intervals. The depth of the crack (z) at delay time (t) was calculated using Eq. 1
| (1) |
where α = 4.7 × 10⁻⁷ m2s−1 is the thermal diffusivity of enamel (23).
Mouse brain and thigh imaging
Two adult CD-1Nude mice (Charles River Breeding Laboratories) were used for brain and thigh imaging following protocol 20011804 approved by the Division of Comparative Medicine of the Faculty of Medicine, University of Toronto. Laboratory animal care guidelines were followed while handling the animal. For the in vivo brain imaging, one mouse was anesthetized by administrating 1 liter/min of oxygen mixed with isoflurane gas (3% for induction and 1 to 1.5% for maintenance). A heating IR lamp was used to regulate the animal temperature. The mouse was laid on an anesthetic machine inclined normally to the camera, and the selected area was illuminated and imaged using the eTC-PCT system under anesthesia. The homogenized laser beam diameter was 3.6 cm, and the size of the IR images was 1.4 cm by 1.12 cm. For ex vivo brain imaging, the skin of the mouse was removed after the mouse was euthanized and imaged using the eTC-PCT system. eTC-PCT imaging of a mouse brain was performed using a 0.03- to 0.1-Hz chirp bandwidth, 81-s duration, and 140-ms pulse width. The energy density on the sample surface was 1.1 J/cm2. The tomographic images were extracted with a time slice width of 10 ms for achieving the highest axial resolution and SNR.
For the thigh imaging, another mouse was used following the same protocol as in the brain imaging. The eTC-PCT imaging was acquired using a 0.07- to 0.1-Hz chirp bandwidth, 81-s duration, and 70-ms pulse width light source as an external illumination. The laser beam diameter was 3 cm, and the IR image size was 1.35 cm by 1.08 cm. The energy density on the sample surface was 0.79 J/cm2, which was less than the maximum permissible exposure, which is an important feature toward clinical applications of the eTC-PCT technique. The tomographic images were extracted with a time slice width of 100 ms to achieve higher signal quality.
Cancer cell preparation
In this study, FaDu cell lines isolated from human patient with hypopharyngeal head and neck squamous cell carcinoma (American Type Culture Collection, Manassas, VA) and cultured in minimal essential medium (MEM) F-15 supplemented with 10% fetal bovine serum were used for developing a tumor in the mouse thigh. The right thigh of the nude mouse was injected subcutaneously with 4.8 × 10⁶ cultured cells/30 μl and imaged consecutively with the eTC-PCT system to monitor the progression of the tumor.
Histopathology imaging of the tumor
Nine days after cancer cell inoculation, the mouse was euthanized, and tumorous tissues were extracted and sent to Princess Margaret Hospital, Toronto, ON, for histopathology analysis. The extracted tissues were fixed in 4% of neutral-buffered formalin and routinely processed in paraffin wax. H&E staining was conducted using standard procedures and reviewed under a microscope.
Experimental thermophotonic imaging system
The eTC-PCT imaging modality (Fig. 1, A and C) was used to implement the high-resolution image processing method. The system uses a function generator (Keysight 33500B, USA) to generate a linear frequency modulation (LFM) excitation chirp that controls the diode laser (808 nm; Jenoptic JOLD-120-QPXF-2P) through a laser driver (PCO-6131; Directed Energy, CO, USA). A high-speed DAQ device (NI PCI-6281) receives the excitation signal, which is used to generate a reference linear frequency modulation waveform (LFM chirp). The laser beam passes through a collimator (F22SMA-B; Thorlabs Inc., NJ, USA), and a diffuser (ED1-C20; Thorlabs Inc., NJ, USA) for collimation, expansion, and homogenization. The final component is the IR camera (A6700sc, FLIR, USA; 3- to 5-μm spectral response), which documents the thermal profile of the laser-irradiated sample at a frame rate of 104 Hz. The entire system is controlled by a computer.
Micro–computed tomography
A μCT system (Skyscan1172 μCT system, Bruker MicroCT, Kontich, Belgium) was used to take images of teeth. The tooth was fixed on a LEGO block and placed in the field of view of the μCT detector. X-rays were generated at a voltage of 100 kV with an exposure time of 590 ms per frame. The tooth was rotated 360° with an angular step of 0.4°. μCT images (n = 987) of size 1724 × 1392 were reconstructed using NRecon software (version: 1.7.4; Skyscan, Kontich, Belgium).
Acknowledgments
We thank the Princess Margaret Hospital, Toronto, ON, for histopathology analysis.
Funding: The authors gratefully acknowledge the New Frontiers in Research Fund–Exploration (NFRFE-2019-00647), the NSERC Discovery Grants Program (RGPIN-2020-04595), the Canada Foundation for Innovation (CFI) Research Chairs Program (950-230876), the NSERC–Collaborative Research and Training Experience (CREATE) (496439-2017), and the CFI-JELF program (38794) for financial support.
Author contributions: Conceptualization: D.T. and A.M. Methodology: D.T., P.T., and A.M. Investigation: D.T., P.T., G.Z., A.Z., K.S., E.B.S., and A.A. Visualization: D.T. Supervision: A.M. Writing: D.T. and A.M. Writing (review and editing): D.T., K.S., and A.M.
Competing interests: P.T., K.S., and A.M. are inventors on a patent related to this work (no. US11231358B2, filed 12 June 2020, published 25 January 2022). The authors declare no other competing interests.
Data and materials availability: All data needed to evaluate the conclusions in the paper are present in the paper and/or Supplementary Materials. Superresolution eTC-PCT codes are available at Zenodo (doi.org/10.5281/zenodo.8393242).
Supplementary Materials
This PDF file includes:
Supplementary Text
Figs. S1 and S2
References
REFERENCES AND NOTES
- 1.M.-H. Chien, M. Brameshuber, B. K. Rossboth, G. J. Schütz, S. Schmid, Single-molecule optical absorption imaging by nanomechanical photothermal sensing. Proc. Natl. Acad. Sci. U.S.A. 115, 11150–11155 (2018). [DOI] [PMC free article] [PubMed] [Google Scholar]
- 2.E. B. Shokouhi, R. Welch, K. Sivagurunathan, A. Mandelis, Multispectral truncated-correlation photothermal coherence tomography imaging modality for detection of early stage dental caries. Biomed. Opt. Express 13, 2772–2781 (2022). [DOI] [PMC free article] [PubMed] [Google Scholar]
- 3.P. Tavakolian, E. B. Shokouhi, S. Sfarra, G. Gargiulo, A. Mandelis, Non-destructive imaging of ancient marquetries using active thermography and photothermal coherence tomography. J. Cult. Herit. 46, 159–164 (2020). [Google Scholar]
- 4.K. Sebastian, A. Melnikov, K. Sivagurunathan, X. Guo, X. Wang, A. Mandelis, Non-destructive lock-in thermography of green powder metallurgy component inhomogeneities: A predictive imaging method for manufactured component flaw prevention. NDT E Int. 127, 102603 (2022). [Google Scholar]
- 5.S. Kaiplavil, A. Mandelis, Truncated-correlation photothermal coherence tomography for deep subsurface analysis. Nat. Photonics. 8, 635–642 (2014). [Google Scholar]
- 6.P. Tavakolian, K. Sivagurunathan, A. Mandelis, Enhanced truncated-correlation photothermal coherence tomography with application to deep subsurface defect imaging and 3-dimensional reconstructions. J. Appl. Phys. 122, 023103 (2017). [Google Scholar]
- 7.S. Roointan, P. Tavakolian, K. S. Sivagurunathan, M. Floryan, A. Mandelis, S. H. Abrams, 3D dental subsurface imaging using enhanced truncated correlation-photothermal coherence tomography. Sci. Rep. 9, 16788 (2019). [DOI] [PMC free article] [PubMed] [Google Scholar]
- 8.D. Thapa, R. Welch, R. P. Dabas, M. Salimi, P. Tavakolian, K. Sivagurunathan, K. Ngai, B. Huang, Y. Finer, S. Abrams, Comparison of long-wave and mid-wave infrared imaging modalities for photothermal coherence tomography of human teeth. I.E.E.E. Trans. Biomed. Eng. 69, 2755–2766 (2022). [DOI] [PubMed] [Google Scholar]
- 9.R. Welch, K. Sivagurunathan, P. Tavakolian, K. Ngai, B. Huang, S. Abrams, Y. Finer, A. Mandelis, Detection of bacteria-induced early-stage dental caries using three-dimensional mid-infrared thermophotonic imaging. Bioengineering 10, 112 (2023). [DOI] [PMC free article] [PubMed] [Google Scholar]
- 10.R. Welch, K. Sivagurunathan, P. Tavakolian, A. Mandelis, Three-dimensional thermophotonic image optimization modalities of truncated correlation photothermal coherence tomography. J. Biophotonics 15, e202200018 (2022). [DOI] [PubMed] [Google Scholar]
- 11.P. Burgholzer, M. Thor, J. Gruber, G. Mayr, Three-dimensional thermographic imaging using a virtual wave concept. J. Appl. Phys. 121, 105102 (2017). [Google Scholar]
- 12.P. Burgholzer, G. Mayr, G. Thummerer, M. Haltmeier, Heat diffusion blurs photothermal images with increasing depth. J. Appl. Phys. 131, (2022). [Google Scholar]
- 13.P. Burgholzer, T. Berer, J. Gruber, G. Mayr, Super-resolution thermographic imaging using blind structured illumination. Appl. Phys. Lett. 111, 211101 (2017). [Google Scholar]
- 14.P. Tavakolian, S. Roointan, A. Mandelis, Non-invasive in-vivo 3-D imaging of small animals using spatially filtered enhanced truncated-correlation photothermal coherence tomography. Sci. Rep. 10, 13743 (2020). [DOI] [PMC free article] [PubMed] [Google Scholar]
- 15.S. S. S. Choi, A. Mandelis, Review of the state of the art in cardiovascular endoscopy imaging of atherosclerosis using photoacoustic techniques with pulsed and continuous-wave optical excitations. J. Biomed. Opt. 24, 080902 (2019). [DOI] [PMC free article] [PubMed] [Google Scholar]
- 16.ImageJ. "Volume Viewer," Assessed on September 26, 2022.
- 17.J. S. Mamoun, D. Napoletano, Cracked tooth diagnosis and treatment: An alternative paradigm. Eur. J. Dent. 9, 293–303 (2015). [DOI] [PMC free article] [PubMed] [Google Scholar]
- 18.S. H. Abrams, K. S. Sivagurunathan, Detecting cracks in teeth and monitoring structural integrity over time with non-invasive PTR-LUM technology a solution for a major clinical challenge. J. Appl. Phys. 131, 164501 (2022). [Google Scholar]
- 19.S. Abrams, Improving the way to detect cracks in teeth. Dent. Today 32, 104–106 (2013). [PubMed] [Google Scholar]
- 20.G. M. Cooper, R. E. Hausman, R. E. Hausman, The Cell: A Molecular Approach (ASM Press, 2007), vol. 4. [Google Scholar]
- 21.E. B. Shokouhi, M. Razani, A. Gupta, N. Tabatabaei, Comparative study on the detection of early dental caries using thermo-photonic lock-in imaging and optical coherence tomography. Biomed. Opt. Express 9, 3983–3997 (2018). [DOI] [PMC free article] [PubMed] [Google Scholar]
- 22.Laser Institute of America, ANSI Z136.1-2014 American National Standard for safe use of lasers (ANSI, 2014). [Google Scholar]
- 23.P. Lancaster, D. Brettle, F. Carmichael, V. Clerehugh, In-vitro thermal maps to characterize human dental enamel and dentin. Front. Physiol. 8, 461 (2017). [DOI] [PMC free article] [PubMed] [Google Scholar]
- 24.K. Masaoka, T. Yamashita, Y. Nishida, M. Sugawara, Modified slanted-edge method and multidirectional modulation transfer function estimation. Opt. Express 22, 6040–6046 (2014). [DOI] [PubMed] [Google Scholar]
- 25.E. Samei, M. J. Flynn, D. A. Reimann, A method for measuring the presampled MTF of digital radiographic systems using an edge test device. Med. Phys. 25, 102–113 (1998). [DOI] [PubMed] [Google Scholar]
- 26.H. Li, C. Yan, J. Shao, Measurement of the modulation transfer function of infrared imaging system by modified slant edge method. J. Opt. Soc. Korea 20, 381–388 (2016). [Google Scholar]
- 27.F. Lai, J. Kandukuri, B. Yuan, Z. Zhang, M. Jin, Thermal image enhancement through the deconvolution methods for low-cost infrared cameras. Quant. InfraRed. Thermogr. J. 15, 223–239 (2018). [DOI] [PMC free article] [PubMed] [Google Scholar]
- 28.L. B. Lucy, An iterative technique for the rectification of observed distributions. Astron. J. 79, 745 (1974). [Google Scholar]
- 29.V. E. Pera, E. L. Heffer, H. Siebold, O. Schütz, S. Heywang-Köbrunner, L. Götz, A. Heinig, S. Fantini, Spatial second-derivative image processing: An application to optical mammography to enhance the detection of breast tumors. J. Biomed. Opt. 8, 517–524 (2003). [DOI] [PubMed] [Google Scholar]
Associated Data
This section collects any data citations, data availability statements, or supplementary materials included in this article.
Supplementary Materials
Supplementary Text
Figs. S1 and S2
References


