iBet uBet web content aggregator. Adding the entire web to your favor.


Link to original content: https://pubmed.ncbi.nlm.nih.gov/9670049
Selective recruitment of immature and mature dendritic cells by distinct chemokines expressed in different anatomic sites - PubMed Skip to main page content
U.S. flag

An official website of the United States government

Dot gov

The .gov means it’s official.
Federal government websites often end in .gov or .mil. Before sharing sensitive information, make sure you’re on a federal government site.

Https

The site is secure.
The https:// ensures that you are connecting to the official website and that any information you provide is encrypted and transmitted securely.

Access keys NCBI Homepage MyNCBI Homepage Main Content Main Navigation
. 1998 Jul 20;188(2):373-86.
doi: 10.1084/jem.188.2.373.

Selective recruitment of immature and mature dendritic cells by distinct chemokines expressed in different anatomic sites

Affiliations

Selective recruitment of immature and mature dendritic cells by distinct chemokines expressed in different anatomic sites

M C Dieu et al. J Exp Med. .

Abstract

DCs (dendritic cells) function as sentinels of the immune system. They traffic from the blood to the tissues where, while immature, they capture antigens. They then leave the tissues and move to the draining lymphoid organs where, converted into mature DC, they prime naive T cells. This suggestive link between DC traffic pattern and functions led us to investigate the chemokine responsiveness of DCs during their development and maturation. DCs were differentiated either from CD34(+) hematopoietic progenitor cells (HPCs) cultured with granulocyte/macrophage colony-stimulating factor (GM-CSF) plus tumor necrosis factor (TNF)-alpha or from monocytes cultured with GM-CSF plus interleukin 4. Immature DCs derived from CD34(+) HPCs migrate most vigorously in response to macrophage inflammatory protein (MIP)-3alpha, but also to MIP-1alpha and RANTES (regulated on activation, normal T cell expressed and secreted). Upon maturation, induced by either TNF-alpha, lipopolysaccharide, or CD40L, DCs lose their response to these three chemokines when they acquire a sustained responsiveness to a single other chemokine, MIP-3beta. CC chemokine receptor (CCR)6 and CCR7 are the only known receptors for MIP-3alpha and MIP-3beta, respectively. The observation that CCR6 mRNA expression decreases progressively as DCs mature, whereas CCR7 mRNA expression is sharply upregulated, provides a likely explanation for the changes in chemokine responsiveness. Similarly, MIP-3beta responsiveness and CCR7 expression are induced upon maturation of monocyte- derived DCs. Furthermore, the chemotactic response to MIP-3beta is also acquired by CD11c+ DCs isolated from blood after spontaneous maturation. Finally, detection by in situ hybridization of MIP-3alpha mRNA only within inflamed epithelial crypts of tonsils, and of MIP-3beta mRNA specifically in T cell-rich areas, suggests a role for MIP-3alpha/CCR6 in recruitment of immature DCs at site of injury and for MIP-3beta/CCR7 in accumulation of antigen-loaded mature DCs in T cell-rich areas.


Figures
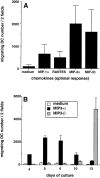
Figure 1
Figure 1
Responses to MIP-3α and MIP-3β during development/ maturation of DCs from CD34+ HPCs. CD34+ HPCs were cultured in presence of GM-CSF plus TNF-α for 13 d. (A) Migration assays were performed between days 10 and 13. Results represent the means of optimal responses for each chemokines obtained in 20 independent experiments. (B) At the indicated time points, aliquots of cells were recovered and tested for their response to MIP-3α (10–1,000 ng/ml) and to MIP-3β (10–1,000 ng/ml), the optimal concentrations being shown. Results are representative of more than three experiments. Migration assays were performed in Boyden microchambers. Results are expressed as number of migrating cells per two low power fields (original magnification: ×20).
Figure 2
Figure 2
Dose responses to MIP-3α and to MIP-3β of CD34+-derived DCs at different stages of development/maturation. CD34+ HPCs were cultured in presence of GM-CSF plus TNF-α for 13 d. Expression of CD1a (FITC) and CD86 (PE) is shown at days 6, 10 and 13 of culture (top). Dose responses to MIP-3α and to MIP-3β are shown at the same time points (bottom). Migration assays were performed in Boyden microchambers. Results are expressed as number of migrating cells per two low power fields (original magnification: ×20). Results are representative of more than three experiments.
Figure 3
Figure 3
CD1a+CD86 immature DCs and CD1a+CD86+ mature DCs respond to MIP-3α and MIP-3β, respectively. CD34+ HPCs were cultured in the presence of GM-CSF plus TNF-α. At day 10, DCs were FACS® sorted according to CD86 expression into CD1a+CD86 immature DCs and CD1a+CD86+ mature DCs, and their response to MIP-3α (10–1,000 ng/ml) and MIP-3β (10–1,000 ng/ml) were determined by migration assays in Boyden microchambers. Results are expressed as index of migrating cells (ratio chemokine/medium), the optimal concentrations being shown. Results are representative of three experiments.
Figure 4
Figure 4
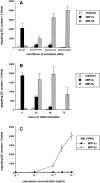
Different signals triggering DC maturation block the response to MIP-3α and induce that to MIP-3β. CD34+ HPCs were cultured in presence of GM-CSF plus TNF-α until day 6 and in presence of GM-CSF alone from day 6 to 12 to preserve their immaturity. (A) At day 12, DCs were cultured for 48 h in presence of GM-CSF with or without TNF-α (2.5 ng/ml), LPS (10 ng/ml), or CD40L and assessed for their response to MIP-3α (10–1,000 ng/ml) and to MIP-3β (10–1,000 ng/ml), the optimal concentrations being shown. (B) At day 12, DCs were cultured for 72 h in the presence of GM-CSF and CD40L and their response to MIP-3α (10–1,000 ng/ml) and to MIP-3β (10–1,000 ng/ml) were assessed at the indicated time points, the optimal concentrations being shown. (C) At day 12, DCs were cultured for 48 h in presence of GM-CSF and CD40L. Dose responses to MIP-3α and MIP-3β are shown. Migration assays were performed in Boyden microchambers. Results are expressed as number of migrating cells per two low power fields (original magnification: ×20). Results are representative of more than three experiments.
Figure 5
Figure 5
CCR6 mRNA downregulation and CCR7 mRNA upregulation during CD34+-derived DC activation/maturation induced by TNF-α or CD40L. (A) CD34+ HPCs were cultured in the presence of GM-CSF plus TNF-α for 14 d. At the indicated time points, aliquots of cells were recovered, mRNA was extracted, and expressions of CCR6 and CCR7 mRNA were determined. (B) CD34+ HPCs were cultured in the presence of GM-CSF plus TNF-α until day 6 and in the presence of GM-CSF alone from day 6 to 12 to preserve their immaturity. At day 12, DCs were cultured for 72 h in presence of GM-CSF and CD40L and the expression of CCR6 and CCR7 mRNA were assessed at the indicated time points. Expression of CCR6 and CCR7 mRNA were determined by semi-quantitative RT-PCR (30, 35 cycles). The results at 35 cycles are shown and PCR for β-actin are shown at 21 cycles as an internal mRNA control. Results are representative of three experiments.
Figure 5
Figure 5
CCR6 mRNA downregulation and CCR7 mRNA upregulation during CD34+-derived DC activation/maturation induced by TNF-α or CD40L. (A) CD34+ HPCs were cultured in the presence of GM-CSF plus TNF-α for 14 d. At the indicated time points, aliquots of cells were recovered, mRNA was extracted, and expressions of CCR6 and CCR7 mRNA were determined. (B) CD34+ HPCs were cultured in the presence of GM-CSF plus TNF-α until day 6 and in the presence of GM-CSF alone from day 6 to 12 to preserve their immaturity. At day 12, DCs were cultured for 72 h in presence of GM-CSF and CD40L and the expression of CCR6 and CCR7 mRNA were assessed at the indicated time points. Expression of CCR6 and CCR7 mRNA were determined by semi-quantitative RT-PCR (30, 35 cycles). The results at 35 cycles are shown and PCR for β-actin are shown at 21 cycles as an internal mRNA control. Results are representative of three experiments.
Figure 6
Figure 6
MIP-3α and MIP-3β induce Ca2+ flux on only immature and mature DCs, respectively. CD34+ HPCs were cultured in the presence of GM-CSF plus TNF-α until day 6 and in the presence of GM-CSF alone from day 6 to 12 (immature/resting DCs). At day 12, DCs were cultured for 48 h in presence of GM-CSF and CD40L (mature/ activated DC). Immature/resting DC (A) and mature/CD40-activated DCs (B) were tested for their response to MIP-3α (1,000 ng/ml) and to MIP-3β (1,000 ng/ml) in Ca2+ flux. Dose responses in Ca2+ flux are shown for MIP-3α and MIP-3β on, respectively, immature/resting DCs (C) and mature/ CD40-activated DCs (D). Results are representative of three experiments.
Figure 7
Figure 7
The response to MIP-3β is induced upon maturation of monocyte-derived DCs. DCs were generated by culturing monocytes in presence of GM-CSF+IL-4 for 6 d. (A) DCs were cultured in the presence of GM-CSF (resting) or in the presence of GM-CSF and CD40L (activated). Dose responses to MIP-1α, RANTES, and MIP-3β were determined after 48 h. (B) DCs were cultured for 48 h in the presence of GM-CSF with or without TNF-α (2.5 ng/ml), LPS (10 ng/ml), or CD40L and assessed for their responses to MIP-1α (10–1,000 ng/ ml) and to MIP-3β (10–1000 ng/ml), the optimal concentrations being shown. Migration assays were performed in Boyden microchambers. Results are expressed as number of migrating cells per two low power fields (original magnification: ×20). Results are representative of more than three experiments.
Figure 7
Figure 7
The response to MIP-3β is induced upon maturation of monocyte-derived DCs. DCs were generated by culturing monocytes in presence of GM-CSF+IL-4 for 6 d. (A) DCs were cultured in the presence of GM-CSF (resting) or in the presence of GM-CSF and CD40L (activated). Dose responses to MIP-1α, RANTES, and MIP-3β were determined after 48 h. (B) DCs were cultured for 48 h in the presence of GM-CSF with or without TNF-α (2.5 ng/ml), LPS (10 ng/ml), or CD40L and assessed for their responses to MIP-1α (10–1,000 ng/ ml) and to MIP-3β (10–1000 ng/ml), the optimal concentrations being shown. Migration assays were performed in Boyden microchambers. Results are expressed as number of migrating cells per two low power fields (original magnification: ×20). Results are representative of more than three experiments.
Figure 8
Figure 8
CCR7 is rapidly induced upon CD40 and TNF-α activation of monocyte-derived DCs. DCs were generated by culturing monocytes in presence of GM-CSF+IL-4 for 6 d. DCs were activated in presence of GM-CSF plus TNF-α or GM-CSF+CD40L. At the indicated time points, the expression of CCR7 mRNA was assessed by semi-quantitative RT-PCR (30, 35 cycles). Results at 35 cycles are shown and PCR for β-actin are shown at 21 cycles as an internal mRNA control. Results are representative of three experiments.
Figure 8
Figure 8
CCR7 is rapidly induced upon CD40 and TNF-α activation of monocyte-derived DCs. DCs were generated by culturing monocytes in presence of GM-CSF+IL-4 for 6 d. DCs were activated in presence of GM-CSF plus TNF-α or GM-CSF+CD40L. At the indicated time points, the expression of CCR7 mRNA was assessed by semi-quantitative RT-PCR (30, 35 cycles). Results at 35 cycles are shown and PCR for β-actin are shown at 21 cycles as an internal mRNA control. Results are representative of three experiments.
Figure 9
Figure 9
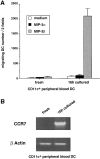
CD11c+ peripheral blood DCs respond to MIP-3β but not to MIP-3α upon spontaneous maturation. CD11c+ DCs were FACS® sorted from PBLs according to their lack of lineage markers and expression of CD4 and CD11c (see Materials and Methods). (A) The responses to MIP-3α (500 ng/ml) and to MIP-3β (500 ng/ml) were determined after FACS® sorting and after 16-h culture with GM-CSF. Migration assays were performed in Boyden microchambers. Results are expressed as number of migrating cells per two low power fields (original magnification: ×20). Results are representative of four experiments. (B) The expression of CCR7 mRNA was assessed by semiquantitative RT-PCR. Results at 35 cycles are shown, and PCR for β actin is shown at 21 cycles as an internal mRNA control. Results are representative of three experiments.
Figure 10
Figure 10
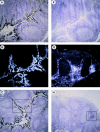
In vivo MIP-3α is expressed in inflamed epithelium and MIP-3β within T cell–rich areas of tonsils. Human tonsil sections were hybridized with antisense (A–D, F–I) and sense (E and J) 35S-labeled RNA probes for MIP-3α (A–E) and MIP-3β (F–J), and were exposed for 24 d. A and F, D and E, and I and J are serial cryostat sections. D and I are higher magnification of inset areas of C and H, respectively. (B and G) Darkfield illuminations are the same areas shown in A and H, respectively. MIP-3α mRNA is strongly expressed within epithelial crypts, no signal is seen within the T cell–rich areas nor the B cell–rich areas (A–C). MIP-3α mRNA is expressed in cells lining the epithelial crypts (D). MIP-3β mRNA is detected within the T cell– rich areas, no signal is seen within the B cell follicles nor in the epithelial crypts (F–H). MIP-3β mRNA is strongly expressed in scattered cells spread over the T cell areas around blood vessels (I). The sense probes do not generate background hybridization (E and J). Original magnification: A–C and F–H, ×40; D and E, ×100; (I and J), ×200.
Figure 10
Figure 10
In vivo MIP-3α is expressed in inflamed epithelium and MIP-3β within T cell–rich areas of tonsils. Human tonsil sections were hybridized with antisense (A–D, F–I) and sense (E and J) 35S-labeled RNA probes for MIP-3α (A–E) and MIP-3β (F–J), and were exposed for 24 d. A and F, D and E, and I and J are serial cryostat sections. D and I are higher magnification of inset areas of C and H, respectively. (B and G) Darkfield illuminations are the same areas shown in A and H, respectively. MIP-3α mRNA is strongly expressed within epithelial crypts, no signal is seen within the T cell–rich areas nor the B cell–rich areas (A–C). MIP-3α mRNA is expressed in cells lining the epithelial crypts (D). MIP-3β mRNA is detected within the T cell– rich areas, no signal is seen within the B cell follicles nor in the epithelial crypts (F–H). MIP-3β mRNA is strongly expressed in scattered cells spread over the T cell areas around blood vessels (I). The sense probes do not generate background hybridization (E and J). Original magnification: A–C and F–H, ×40; D and E, ×100; (I and J), ×200.

Similar articles

Cited by

References

    1. Steinman RM. The dendritic cell system and its role in immunogenicity. Annu Rev Immunol. 1991;9:271–296. - PubMed
    1. Kaplan G, Walsh G, Guido LS, Meyn P, Burkhardt RA, Abalos RM, Barker J, Frindt PA, Fajardo TT, Celona R, Cohn ZA. Novel responses of human skin to intradermal recombinant granulocyte/macrophage-colony–stimulating factor: Langerhans cell recruitment, keratinocyte growth, and enhanced wound healing. J Exp Med. 1992;175:1717–1728. - PMC - PubMed
    1. McWilliam AS, Nelson D, Thomas JA, Holt PG. Rapid dendritic cell recruitment is a hallmark of the acute inflammatory response at mucosal surfaces. J Exp Med. 1994;179:1331–1336. - PMC - PubMed
    1. Inaba K, Schuler G, Witmer MD, Valinksy J, Atassi B, Steinman RM. Immunologic properties of purified epidermal Langerhans cells. Distinct requirements for stimulation of unprimed and sensitized T lymphocytes. J Exp Med. 1986;164:605–613. - PMC - PubMed
    1. Streilein JW, Grammer SF. In vitro evidence that Langerhans cells can adopt two functionally distinct forms capable of antigen presentation to T lymphocytes. J Immunol. 1989;143:3925–3933. - PubMed

Publication types

MeSH terms