iBet uBet web content aggregator. Adding the entire web to your favor.


Link to original content: https://pubmed.ncbi.nlm.nih.gov/9382897
On the structural basis for size-selective permeation of organic cations through the voltage-gated sodium channel. Effect of alanine mutations at the DEKA locus on selectivity, inhibition by Ca2+ and H+, and molecular sieving - PubMed Skip to main page content
U.S. flag

An official website of the United States government

Dot gov

The .gov means it’s official.
Federal government websites often end in .gov or .mil. Before sharing sensitive information, make sure you’re on a federal government site.

Https

The site is secure.
The https:// ensures that you are connecting to the official website and that any information you provide is encrypted and transmitted securely.

Access keys NCBI Homepage MyNCBI Homepage Main Content Main Navigation
. 1997 Dec;110(6):693-715.
doi: 10.1085/jgp.110.6.693.

On the structural basis for size-selective permeation of organic cations through the voltage-gated sodium channel. Effect of alanine mutations at the DEKA locus on selectivity, inhibition by Ca2+ and H+, and molecular sieving

Affiliations

On the structural basis for size-selective permeation of organic cations through the voltage-gated sodium channel. Effect of alanine mutations at the DEKA locus on selectivity, inhibition by Ca2+ and H+, and molecular sieving

Y M Sun et al. J Gen Physiol. 1997 Dec.

Abstract

Recent evidence indicates that ionic selectivity in voltage-gated Na+ channels is mediated by a small number of residues in P-region segments that link transmembrane elements S5 and S6 in each of four homologous domains denoted I, II, III, and IV. Important determinants for this function appear to be a set of conserved charged residues in the first three homologous domains, Asp(I), Glu(II), and Lys(III), located in a region of the pore called the DEKA locus. In this study, we examined several Ala-substitution mutations of these residues for alterations in ionic selectivity, inhibition of macroscopic current by external Ca2+ and H+, and molecular sieving behavior using a series of organic cations ranging in size from ammonium to tetraethylammonium. Whole-cell recording of wild-type and mutant channels of the rat muscle micro1 Na+ channel stably expressed in HEK293 cells was used to compare macroscopic current-voltage behavior in the presence of various external cations and an intracellular reference solution containing Cs+ and very low Ca2+. In particular, we tested the hypothesis that the Lys residue in domain III of the DEKA locus is responsible for restricting the permeation of large organic cations. Mutation of Lys(III) to Ala largely eliminated selectivity among the group IA monovalent alkali cations (Li+, Na+, K+, Rb+, Cs+) and permitted inward current of group IIA divalent cations (Mg2+, Ca2+, Sr2+, Ba2+). This same mutation also resulted in the acquisition of permeability to many large organic cations such as methylammonium, tetramethylammonium, and tetraethylammonium, all of which are impermeant in the native channel. The results lead to the conclusion that charged residues of the DEKA locus play an important role in molecular sieving behavior of the Na+ channel pore, a function that has been previously attributed to a hypothetical region of the channel called the "selectivity filter." A detailed examination of individual contributions of the Asp(I), Glu(II), and Lys(III) residues and the dependence on molecular size suggests that relative permeability of organic cations is a complex function of the size, charge, and polarity of these residues and cation substrates. As judged by effects on macroscopic conductance, charged residues of the DEKA locus also appear to play a role in the mechanisms of block by external Ca2+ and H+, but are not essential for the positive shift in activation voltage that is produced by these ions.


Figures
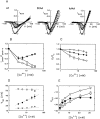
Figure 3
Figure 3
Effect of increasing extracellular Ca2+ on macroscopic current parameters in the presence of Na+. (A) Normalized peak I–V relations and Boltzmann fits (solid lines) for HEK293 cells expressing wild-type, DEAA, or AAAA mutants. Points correspond to peak I–V data recorded in the presence of 140 mM NaCl plus 1 mM CaCl2 (○), or 100 mM Na+ plus the following mixtures of CaCl2/Tris-Cl (mM): 3.5/37.5 (•), 6/35 (▿), 11/30 (▾), 21/20 (□), 31/10 (▪). (B) Plot of the maximal peak current in the presence of increasing external Ca2+ normalized to that in the presence of 140 mM Na+ plus 1 mM Ca2+. (C) Plot of maximal macroscopic conductance (G max) in the presence of increasing Ca2+ normalized to that in the presence of 140 mM Na+ plus 1 mM Ca2+. (D) Plot of the reversal potential (Vrev) in solutions containing 100 mM NaCl and increasing Ca2+. (E) Plot of the measured V 0.5 parameter for voltage activation as a function of increasing Ca2+. Symbols in B–D refer to wild-type (○), DEAA (•), and AAAA (▿) mutants. Data points and error bars in B–E correspond to the mean ± SD for four cells. Solid lines in B, C, and E connect the points and have no theoretical significance. The dotted lines in D are fits to the extended Goldman-Hodgkin-Katz equation (Lewis, 1979) using the following values for P Ca/P Na: 0.02, DEKA; 18.9, DEAA; 0.26, AAAA.
Figure 4
Figure 4
Effect of extracellular pH on macroscopic current parameters. (A–C) Peak I–V relations and Boltzmann fits (solid lines) for HEK293 cells expressing wild-type (A), DEAA (B), and AAAA (C) mutants in solutions containing 140 mM external Na+ at the following pH values: 8.0 (○), 7.3 (•), 6.5 (▿), 6.0 (▾), 5.5 (□), 5.0 (▪), 4.5 (▵), 4.0 (▴). Current values are normalized to the peak current at pH 7.3. (D) Plot of maximal conductance (Gmax) at various external pH values normalized to pH 7.3. Dotted lines are fit to the function, G max/ G max, pH 7.3 = 1 − {R max (1 + [H+]0.5 /[H+])}, as discussed in results. (E) Plot of the measured V 0.5 parameter for voltage activation as a function of external pH. Solid lines have no theoretical significance. Data points and error bars in D and E correspond to the mean ± SD for six to eight cells. Symbols in D and E refer to wild-type (○), DEAA (•), and AAA (▿) mutants.
Figure 1
Figure 1
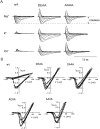
Comparison of group IA monovalent cation permeation in μ1 wild-type (wt) and mutant Na+ channels expressed in HEK293 cells. (A) Typical currents recorded in the presence of extracellular Na+, K+, or Cs+ for wild-type, DEAA, and AAAA mutants. Currents shown were elicited from a holding voltage of −120 mV by step depolarizations ranging from –90 to +50 mV in steps of 10 mV. Currents from each cell are normalized to the peak Na+ current from the same cell recorded in control Na+ solution as indicated by the vertical scale labeled I (Na,Norm). (B) Normalized peak I–V relations for typical cells expressing wild-type, DEAA, DAAA, AEAA, or AAAA mutants. Solid line curves indicate fits to a Boltzmann function (Eq. 1). Data for the following group IA monovalent cation solutions (140 mM Cl salts) are superimposed: Na+ (○), Li+ (•), K+ (▿), Rb+ (▾), and Cs+ (□).
Figure 2
Figure 2
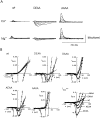
Comparison of group IIA divalent cation permeation in wild-type and mutant Na+ channels. (A) Typical currents recorded in the presence of extracellular Ca2+ or Mg2+ for wild-type, DEAA, and AAAA mutants. Currents were activated by the same voltage protocol described in Fig. 1. The vertical calibration is 1× for normalized peak Na+ current. (B) Normalized peak I–V relations and Boltzmann fits (solid lines) for typical cells expressing wild-type, DEAA, DAAA, AEAA, or AAAA mutants. Data recorded in Na+ and the following group IIA divalent cation solutions (90 mM) are superimposed: Na+ (○), Ca2+ (•), Mg2+ (▿), Sr2+ (▾), and Ba2+ (□). The current scale is truncated to magnify results for divalent cations. The lower right panel shows normalized peak I–V data for Ca2+ as compared with the wild-type and indicated mutants.
Figure 5
Figure 5
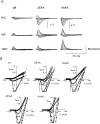
Comparison of the permeation behavior of ammonium and methylated ammonium derivatives in wild-type and mutant Na+ channels. (A) Typical currents recorded in the presence of extracellular NH4 +, MA, and TMA for wild-type, DEAA, and AAAA mutants. Currents were activated by step depolarization from a holding voltage of −120 mV to voltages ranging from −90 to +60 mV in steps of 10 mV. Currents are normalized to the peak Na+ current from the same cell corresponding to the 1× vertical scale bar. NH4 + currents for DEAA and AAAA are shown at half scale. (B) Normalized peak I–V relations for typical cells expressing wild-type, DEAA, DAAA, AEAA, or AAAA mutants. Solid line curves indicate fits to a Boltzmann function (Eq. 1). I–V relations recorded in the following cation solutions (140 mM Cl salts) are superimposed: Na+ (○), NH4 + (•), MA (▿), DMA (▾), TriMA (□), and TMA (▪).
Figure 6
Figure 6
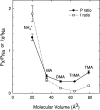
Anomalous molecular sieving behavior of the DEAA mutant. Maximal peak current relative to Na+ (□) and relative permeability (•) for the series NH4 +, MA, DMA, TriMA, and TMA are plotted versus molecular volume of the cation as measured using Insight software.
Figure 7
Figure 7
Comparison of the permeation behavior of large organic cations in wild-type and mutant Na+ channels. (A) Typical currents recorded in the presence of extracellular EA and TEA for wild-type, DEAA, and AAAA mutants. Currents were activated by the same voltage protocol described in Fig. 5. The vertical calibration corresponds to the normalized peak Na+ current. (B) Normalized peak I–V relations and Boltzmann fits (solid lines) for typical cells expressing wild-type, DEAA, or AAAA mutants. I–V relations recorded in Na+ or the following organic cation solutions (140 mM) are superimposed: Na+ (○), EA (•), EAOH (▿), choline (▾), TEA (□), and Tris (▪). The normalized current scale is truncated to enlarge results for organic cations.
Figure 10
Figure 10
Graphical summary of major results for organic cations. (A) P X/P Na values listed in Table II for organic cations permeable through the DEAA mutant are plotted versus the cube root of molecular volume of the cation (•) or versus the minimum diameter of the cation (○). Minimum diameter is defined by the diameter of a circle that can completely enclose a space-filling representation of the molecule in its narrowest orientation. To indicate the general trend of the data, points for the two different methods of comparing molecular size are fit to a single exponential function as indicated by the solid and dashed lines. (B) Bar graph illustrating the increase in relative permeability (PX/PNa) for small cations and acquisition of new permeability to large cations for AAAA and DEAA mutants as compared with wild type. The axis labeled Organic Cations is numbered from 1–13, denoting permeant cations of Table II in order of increasing molecular volume as follows: NH4 + (1), NH3OH+ (2), MA (3), guanidine (4), EA (5), DMA (6), EAOH (7), aminoguanidine (8), TriMA (9), TMA (10), Tris (11), choline (12), TEA (13).
Figure 8
Figure 8
Comparison of the permeability behavior of guanidinium cations and hydroxylammonium in wild-type and mutant Na+ channels. (A) Typical currents recorded in the presence of extracellular guanidine and hydroxylamine (at pH 6.0) for wild-type, DEAA, and AAAA mutants. Currents were activated by the same voltage protocol described in Fig. 5. The vertical calibration is 1× for normalized peak Na+ current. (B) Normalized peak I–V relations and Boltzmann fits (solid lines) for typical cells expressing wild-type, DEAA, or AAAA mutants. I–V relations recorded in Na+ or the following organic cation solutions (140 mM) are superimposed: Na+ (○), guanidine (•), aminoguanidine (▿), methylguanidine (▾), hydroxylamine at pH 6.9 (□), and hydroxylamine at pH 7.3 (▪). The normalized current scale is truncated for the wild type.
Figure 9
Figure 9
Comparison of the sensitivity to various toxins. (A) Titration curves for inhibition of Na+ current by TTX (○), STX (•), and μ-conotoxin GIIIB (▿) for the wild-type, DEAA, and AAAA mutants. Symbols are the mean ± SEM for three determinations. The ordinate axis is the G max obtained from Boltzmann fitting of the peak I–V relation normalized to that measured in the absence of toxin. Solid lines indicate fits to a one-site inhibition curve: G/G 0 = K I/(K I + [toxin]) with the values for K I given in C. (B) Kinetics of μ-conotoxin GIIIB action for wild-type, DEAA, and AAAA mutants. Voltage-clamped cells were depolarized to +30 mV from a holding voltage of −120 mV at a frequency of 1/30 Hz. Relative conductance at the peak inward current before toxin addition is normalized to 1.0 for each case. The two vertical dotted lines indicate onset of perfusion with toxin-containing solution (1 μM GIIIB) and replacement by toxin-free solution. Data points corresponding to toxin dissociation are fit to a single exponential function with the following rate constants: 2.38 × 10⁻⁴ s−1, DEKA; 1.61 × 10⁻³ s−1, DEAA; 1.38 × 10⁻² s−1, AAAA.
Figure 11
Figure 11
Space-filling models of several molecules illustrating the relative increase in cutoff diameter for AAAA and DEAA mutant Na+ channels. Molecular models of the indicated molecules were constructed and energy minimized with the use of Hyperchem software. The seven molecules are arranged in order of increasing size from H2O (top) to TEA (bottom). Two different views of each molecule are shown to indicate possible size constraints for permeation. Brackets on the right enclose the group of molecules that are permeable through each type of channel.

Similar articles

Cited by

References

    1. Almers W, McCleskey EW. Non-selective conductance in calcium channels of frog muscle: calcium selectivity in a single-file pore. J Physiol (Lond) 1984;353:585–608. - PMC - PubMed
    1. Almers W, McCleskey EW, Palade PT. A non-selective cation conductance in frog muscle membrane blocked by micromolar external calcium ions. J Physiol (Lond) 1984;353:565–583. - PMC - PubMed
    1. Armstrong CM, Cota G. Calcium ion as a cofactor in Na channel gating. Proc Natl Acad Sci USA. 1991;88:6528–6531. - PMC - PubMed
    1. Armstrong CM, Gilly WF. Access resistance and space clamp problems associated with whole-cell patch clamping. Methods Enzymol. 1992;207:100–122. - PubMed
    1. Becker S, Prusak-Sochaczewski E, Zamponi G, Beck-Sickinger AG, Gordon RD, French RJ. Action of derivatives of μ-conotoxin GIIIA on sodium channels. Single amino acid substitutions in the toxin separately affect association and dissociation rates. Biochemistry. 1992;31:8229–8238. - PubMed

Publication types

MeSH terms