iBet uBet web content aggregator. Adding the entire web to your favor.


Link to original content: https://pubmed.ncbi.nlm.nih.gov/6258018
A restriction map of the bacteriophage T4 genome - PubMed Skip to main page content
U.S. flag

An official website of the United States government

Dot gov

The .gov means it’s official.
Federal government websites often end in .gov or .mil. Before sharing sensitive information, make sure you’re on a federal government site.

Https

The site is secure.
The https:// ensures that you are connecting to the official website and that any information you provide is encrypted and transmitted securely.

Access keys NCBI Homepage MyNCBI Homepage Main Content Main Navigation
. 1980;179(2):421-435.
doi: 10.1007/BF00425473.

A restriction map of the bacteriophage T4 genome

A restriction map of the bacteriophage T4 genome

P H O'Farrell et al. Mol Gen Genet. 1980.

Abstract

We report a detailed restriction map of the bacteriophage T4 genome and the alignment of this map with the genetic map. The sites cut by the enzymes Bg/II, XhoI, KpnI, SalI, PstI, EcoRI and HindIII have been localized. Several novel approaches including two-dimensional (double restriction) electrophoretic separations were used.


Figures

Fig. 1
Fig. 1
A map of the regions of the T4 genome deleted in some of the den B mutations used for the construction of C-T4 strains. The mutation labeled Bruner’s “rIIH23” was used by Kiko etal. (1979), Rüger et al., (1979) and Marsh (1980). As discussed by Kutter et al. (1975), this deletion was confused with the original rIIH23. The C-T4 strain used here contains the rIINB5060 deletion. Carlson and Nicolaisen (1979) have used a strain carrying saΔ9 for restriction mapping
Fig. 2
Fig. 2
The restriction map of bacteriophage T4 and its alignment with the genetic map. The positions of BglII, XhoI, PstI, HindIII and EcoRI sites are taken from our own data. The order of most of the SalI, and KpnI fragments is as determined by Carlson (1979). Our data confirmed her order, identified an additional fragment, and defined the alignment of the SalI and KpnI sites with other restriction sites and with the genetic map. The SmaI positions were defined by aligning of the map derived by Kiko et al. (1979) with our map. The genetic map was modified from the map of Wood and Revel (1976) primarily according to data summarized by Mosig (1980). The positions of the genetic markers have been further adjusted to correspond to the physical map according to data from cloned DNA fragments as summarized in Table 5
Fig. 3
Fig. 3
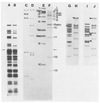
A–J. Representative one dimensional separations. The samples shown in lanes A–F were electrophoresed through a composite gel, the first half being 0.5% and the second half being 1.5% agarose (the arrows indicate the junction of the two gel concentrations). Lanes A–F are from an autoradiogram of this gel. Lane A shows fragments which were produced by XhoI cleavage of T4 DNA, labeled and then further cut with EcoRI (XhoI(32P)/EcoRI). Lane B shows the same sample as A but further digested with BglII (XhoI(32P)/EcoRI, BglII). The sizes determined for the fragments in lane A give the distance between XhoI sites and the adjacent EcoRI sites. These sizes were also used for internal calibration of two dimensiional separations where XhoI cut fragments are separated in the first dimension, recut with EcoRI and separated in the second dimension (XhoI-EcoRI). For molecular weight markers, λ CI857 S7 DNA obtained from Rae Lynn Burke was cut with BglII (lane C) or HindIII (lane D) and labeled. Lanes E and F show respectively, T4 DNA digested with BglII or XhoI and labeled. The band assigments are indicated. Lanes G–J show stained patterns obtained from T4 DNA digested with XhoI (Lane G), BglII (lane H), XhoI and BamHI (lane I) or BglII and BamHI (lane J) and electrophoresed on a 0.5% agarose gel. The stars indicate the bands formed by fragments containing the BamHI site; in the double digests (lines I and J) the arrowheads indicate the positions of the bands generated by BamHI cleavage. The cleavage of BglII 1 is not obvious because fragments in this molecular weight range do not separate well
Fig. 4
Fig. 4
A and B. A representative two dimensional separation: T4 BglII fragemnts recut with XhoI for separation in the second dimension. BglII cut T4 DNA was end-labeled and separated in a 0.5% agarose gel. The separated fragments were digested in situ with XhoI and electrophoresed in the second dimension (1% agarose). Panel A shows an autoradiogram of the entire gel and B shows a small region of the same gel (the area indicated by brackets in A) at lower autoradiographic exposure. The positions of BglII bands after separation in the first dimension are indicated along the top of the figure. A variety of different behaviors typical of such separations can be seen: BglII 1 was only partially digested by XhoI and in the second dimension some of the intact fragment is seen in addition to the two end fragments. Both fragments of the doublet BglII 2ab are partially digested by XhoI to produce 4 end-labeled fragments, some faint partials (p), and some undigested material. BglII 3 is digested to give two end fragments of very similar size, which can be seen as resolved on the lower exposure (B). BglII 3 also generates a faint partial. The lower molecular weight BglII fragments are digested to near completion. BglII 4 is cut once to generate one easily detected end fragment and one end fragment almost as big as the intact fragment (B). The two end fragments of BglII 5 have not been resolved. Fragments BglII 6, 7a and 8b are not cut by XhoI. Fragments 7b, 8a and 9 are cut to give clearly resolved end fragments. BglII 10, which was electrophoresed off the first dimension gel, contains no XhoI sites. The stars indicate two anomalous spots which appear to have been produced by a low level of BglII cleavage at an additional site within BglII 2b, to produce two fragments which each share one end fragment with BglII 2b. The additional site is located at 145.2 and behaves like a BglII star site
Fig. 5
Fig. 5
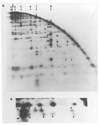
A and B. An example of two-dimensional analysis of partial digests. T4 DNA was digested with SalI, end-labeled and then redigested with a low level of HindIII to generate a partial digest. This partial digest was separated on a 0.5% agarose first dimensional gel. The separated fragments were then digested further with HindIII and electrophoresed through a second dimensional 1.5% agarose gel. Panel A shows an autoradiogram of the entire separation. The arc dominating the pattern is generated by those fragments which were not recut prior to electrophoresis in the second dimension. A fraction of each SalI fragment remains intact during the first partial HindIII digestion and in the first dimension migrates to a position characteristic of the intact SalI fragment. These positions are indicated along the top of the figure. When recut with HindIII and electrophoresed in the second dimension, two terminal labeled SalI HindIII fragments will be generated from each of these SalI fragments. For example, SalI 8 generates a small end fragment (se) and a large end fragment (le) whose positions are indicated in panel A. Furthermore, the first partial HindIII digestion will have generated some labeled partials extending from one end to internal HindIII sites. These partials will migrate faster in the first dimension than the parent SalI fragment. When redigested with HindIII and anlyzed in the second dimension, each of these partials will generate one of the same labeled end fragments produced from the intact SalI fragment (these are labeld p). Thus, SalI 8 generates three detectable partials extending from the end with the large end fragment, le, and two detectable partials extending from the other end, se (one of the se partials was not detected on this gel). The size of each partial gives the distance of a HindIII site from the terminus. Although not intended, the “in situ” digestion prior to running this particular second dimension was also a partial digestion. The resulting partials seen in the second dimension complicate the pattern but can be interpreted. For example, the intact SalI 8 fragment generates in addition to the end fragments a set of partials which, extend to the end defined as le (ple). The larger partials produced by the first partial digestion can also produce lower molecular weight partials in the second dimension. These partials of partials are labeled pp. Note that the molecular weight of fragments extending from, for example, the le end of SalI 8 can be determined from the positions of the partials, p, in the horizontal direction or from the positions of the partials produced in the second dimension, ple, or from the positions of partials of partials, pp. All of these determinations agree. Furthermore, the same map can be obtained from an analysis of fragments extended to the other end, se, of SalI 8. Again the data agrees. - Panel B shows an enlargement of a region of the separation in A, and includes both the large end fragment, le, and the small end fragment, se, generated from SalI 7. The area enlarged in panel B is from the low molecular weight region of the second dimension gel and the equivalent area cannot be readily seen in panel A because it depicts a lower level of autoradiographic exposure. For both le and se, three partials p are clearly resolved, a fourth is only partially resolved and a fifth which is nearly as large as SalI 7 cannot be detected. The size of the four resolved partials determines the positions of 4 HindIII sites and the size of the end fragment defines a fifth. Thus, the size of the small end fragment (se), 0.29 kb, shows that there must be a HindIII site at this distance from the end. The smallest partial, 1 kb, defines the position of the next site and so on. Similarly the positions of the HindIII sites can be read from the other direction by examining le. Independent maps are generated by reading from the two ends and these are consistent with each other. In this case the two maps overlapped for 4 HindIII sites and the map generated by se defines an additional site not seen in the map generated by the other end, le. Similarly, the map generated by le detected one site not seen in the map read from se. Thus, there are six HindIII sites. Although two partials went undetected, the redundancy of the data allows construction of a complete map, and as above this can be confirmed by measurement of partials in the second dimension. It should be noted that the two partials which were not detected would according to their predicted size not be resolvable from intact SalI 7. For large fragments, all the partials are not resolved, but a map of the sites near each end can be constructed. This particular gel could be used to determine all the HindIII sites in SalI 5, SalI 6, SalI 7 and SalI 8 and some of the sites in SalI 1 and SalI 4

Similar articles

Cited by

References

    1. Alwine JC, Kemp DJ, Stark GR. Method for detection of specific RNAs in agarose gels by transfer to diazobenzyloxymethyl-paper and hybridization with DNA probes. Proc Natl Acad Sci USA. 1977;74:5350–5354. - PMC - PubMed
    1. Bautz FA, Bautz EKF. Mapping of deletions in a non-essential region of the phage T4 genome. J Mol Biol. 1977;128:345–355. - PubMed
    1. Carlson K, Nicolaisen B. Cleavage map of bacteriophage T4 cytosine-containing DNA by sequence-specific endonucleases SalI and KpnI. J Virol. 1979;31:112–123. - PMC - PubMed
    1. Depew R, Snopek TJ, Cozzarelli NR. Characterization of a new class of deletions of the D region of the bacteriophage T4 genome. Virology. 1975;64:144–152. - PubMed
    1. Edgar RS, Wood WB. Morphogenesis of bacteriophage T4 in extracts of mutant-infected cells. Proc Natl Acad Sci USA. 1966;55:498–505. - PMC - PubMed

Publication types

LinkOut - more resources