Quantifying the environmental limits to fire spread in grassy ecosystems
- PMID: 35733267
- PMCID: PMC9245651
- DOI: 10.1073/pnas.2110364119
Quantifying the environmental limits to fire spread in grassy ecosystems
Abstract
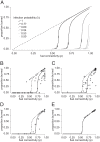
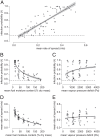
Modeling fire spread as an infection process is intuitive: An ignition lights a patch of fuel, which infects its neighbor, and so on. Infection models produce nonlinear thresholds, whereby fire spreads only when fuel connectivity and infection probability are sufficiently high. These thresholds are fundamental both to managing fire and to theoretical models of fire spread, whereas applied fire models more often apply quasi-empirical approaches. Here, we resolve this tension by quantifying thresholds in fire spread locally, using field data from individual fires (n = 1,131) in grassy ecosystems across a precipitation gradient (496 to 1,442 mm mean annual precipitation) and evaluating how these scaled regionally (across 533 sites) and across time (1989 to 2012 and 2016 to 2018) using data from Kruger National Park in South Africa. An infection model captured observed patterns in individual fire spread better than competing models. The proportion of the landscape that burned was well described by measurements of grass biomass, fuel moisture, and vapor pressure deficit. Regionally, averaging across variability resulted in quasi-linear patterns. Altogether, results suggest that models aiming to capture fire responses to global change should incorporate nonlinear fire spread thresholds but that linear approximations may sufficiently capture medium-term trends under a stationary climate.
Keywords: fire model; fire thresholds; fuel moisture; infection model; percolation.
Conflict of interest statement
The authors declare no competing interest.
Figures


Similar articles
-
Climate change induced declines in fuel moisture may turn currently fire-free Pyrenean mountain forests into fire-prone ecosystems.Sci Total Environ. 2021 Nov 25;797:149104. doi: 10.1016/j.scitotenv.2021.149104. Epub 2021 Jul 17. Sci Total Environ. 2021. PMID: 34303242
-
Global increase in wildfire risk due to climate-driven declines in fuel moisture.Glob Chang Biol. 2022 Feb;28(4):1544-1559. doi: 10.1111/gcb.16006. Epub 2021 Dec 2. Glob Chang Biol. 2022. PMID: 34800319
-
The importance of geography in forecasting future fire patterns under climate change.Proc Natl Acad Sci U S A. 2024 Aug 6;121(32):e2310076121. doi: 10.1073/pnas.2310076121. Epub 2024 Jul 29. Proc Natl Acad Sci U S A. 2024. PMID: 39074287 Free PMC article.
-
Savanna fire regimes depend on grass trait diversity.Trends Ecol Evol. 2022 Sep;37(9):749-758. doi: 10.1016/j.tree.2022.04.010. Epub 2022 May 13. Trends Ecol Evol. 2022. PMID: 35577616 Review.
-
Adapting western North American forests to climate change and wildfires: 10 common questions.Ecol Appl. 2021 Dec;31(8):e02433. doi: 10.1002/eap.2433. Epub 2021 Oct 13. Ecol Appl. 2021. PMID: 34339088 Free PMC article. Review.
Cited by
-
Interactions between soil and other environmental variables modulate forest expansion and ecotone dynamics in humid savannas of Central Africa.Proc Biol Sci. 2024 Oct;291(2033):20241120. doi: 10.1098/rspb.2024.1120. Epub 2024 Oct 30. Proc Biol Sci. 2024. PMID: 39471853 Free PMC article.
-
Road fragment edges enhance wildfire incidence and intensity, while suppressing global burned area.Nat Commun. 2024 Oct 24;15(1):9176. doi: 10.1038/s41467-024-53460-6. Nat Commun. 2024. PMID: 39448625 Free PMC article.
-
Emergent structure and dynamics of tropical forest-grassland landscapes.Proc Natl Acad Sci U S A. 2023 Nov 7;120(45):e2211853120. doi: 10.1073/pnas.2211853120. Epub 2023 Oct 30. Proc Natl Acad Sci U S A. 2023. PMID: 37903268 Free PMC article.
References
-
- Bowman D. M. J. S., et al. , Fire in the earth system. Science 324, 481–484 (2009). - PubMed
-
- Van Der Werf G. R., et al. , Global fire emissions and the contribution of deforestation, savanna, forest, agricultural, and peat fires (1997-2009). Atmos. Chem. Phys. 10, 11707–11735 (2010).
-
- Cuddington K., et al. , Process-based models are required to manage ecological systems in a changing world. Ecosphere 4, 1–12 (2013).
-
- Bradstock R. A., A biogeographic model of fire regimes in Australia: Current and future implications. Glob. Ecol. Biogeogr. 19, 145–158 (2010).
Publication types
MeSH terms
LinkOut - more resources
Full Text Sources
Medical


