iBet uBet web content aggregator. Adding the entire web to your favor.


Link to original content: https://pubmed.ncbi.nlm.nih.gov/35235768
Synthetic mammalian signaling circuits for robust cell population control - PubMed Skip to main page content
U.S. flag

An official website of the United States government

Dot gov

The .gov means it’s official.
Federal government websites often end in .gov or .mil. Before sharing sensitive information, make sure you’re on a federal government site.

Https

The site is secure.
The https:// ensures that you are connecting to the official website and that any information you provide is encrypted and transmitted securely.

Access keys NCBI Homepage MyNCBI Homepage Main Content Main Navigation
. 2022 Mar 17;185(6):967-979.e12.
doi: 10.1016/j.cell.2022.01.026. Epub 2022 Mar 1.

Synthetic mammalian signaling circuits for robust cell population control

Affiliations

Synthetic mammalian signaling circuits for robust cell population control

Yitong Ma et al. Cell. .

Abstract

In multicellular organisms, cells actively sense and control their own population density. Synthetic mammalian quorum-sensing circuits could provide insight into principles of population control and extend cell therapies. However, a key challenge is reducing their inherent sensitivity to "cheater" mutations that evade control. Here, we repurposed the plant hormone auxin to enable orthogonal mammalian cell-cell communication and quorum sensing. We designed a paradoxical population control circuit, termed "Paradaux," in which auxin stimulates and inhibits net cell growth at different concentrations. This circuit limited population size over extended timescales of up to 42 days of continuous culture. By contrast, when operating in a non-paradoxical regime, population control became more susceptible to mutational escape. These results establish auxin as a versatile "private" communication system and demonstrate that paradoxical circuit architectures can provide robust population control.

Keywords: auxin; cell population control; mammalian synthetic biology; paradoxical control; quorum sensing; synthetic circuits; synthetic signaling.


Conflict of interest statement

Declaration of interests A patent application has been filed based on the work described here. M.W.B. is a founder and employee of Primordium Labs.

Figures

Figure 1:
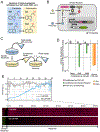
Figure 1:. The plant hormone auxin allows private-channel mammalian cell-cell communication.
(A) Left: an ideal mammalian private-channel communication system would allow engineered cells to send and respond to an orthogonal signal that does not interact with host cells. Middle: Engineered cells that can send and receive the signal simultaneously can respond to their own population size. Right: coupling the sending-receiving function with cell survival in a negative feedback loop enables population control. (B) Auxin Receiver cells constitutively express a fluorescent target fusion protein, mCherry-AID-BlastR, as well as the F-box protein osTIR1. In the presence of auxin (yellow circle), osTIR1 and the AID-tagged target protein assemble into an SCF complex, which allows ubiquitylation of the target protein, leading to target degradation. Both proteins are encoded on a single transcript, with an intervening T2A ribosomal skip sequence (grey square) to yield separate proteins (Szymczak et al., 2004). (C) Auxin regulates intracellular protein levels. The response of mCherry fluorescence in Receiver cells (B) to two different species of auxin (IAA and NAA) was measured after two days of treatment (dots). The responses follow Michaelis-Menten kinetics (fitted lines, Methods), with indicated EC50 values. (D) Auxin regulates cell density. Cells were treated with a combination of IAA and blasticidin at different concentrations for four days and passaged once. Cells were counted by flow cytometry (n=3, error bar = standard deviation). In (C) and (D), the x axis uses a symmetric log (symlog) scale to include a value of 0.
Figure 2:
Figure 2:. Sender-Receiver cells produce and respond to auxin.
(A) Indole-3-acetic acid hydrolases such as iaaH, aux2, and AMI1 hydrolyze inactive auxin precursors (IAM and NAM) to their respective active form (IAA and NAA). (B) Stable expression of iaaH in Receiver cells allows them to produce auxin from precursors (blue square). (C) Conditioned media experiment (schematic). Fresh culture media with or without precursors was added to plated sender cells, collected, mixed at 1:1 ratio with standard fresh media, and then applied to receiver cells. (D) iaaH can produce IAA and NAA auxins from IAM and NAM precursors, respectively. Media with or without precursors were conditioned by Sender-Receivers or standard CHO-K1 cells for 48 hours and applied to Receiver cells for another two days. Receivers cultured with fresh media with or without auxins were also assayed as controls. Data are normalized to Receiver cell fluorescence treated with media conditioned by CHO-K1 cells. Error bars represent standard deviation of 3 replicates. (E) Auxin senders can generate an auxin gradient. Sender-Receivers (green) were seeded within a 7mm x 7mm square at the edge of a 60mm dish, and Receivers were plated everywhere else (Receiver region). One day after plating, the media was replaced with fresh media containing low-melting-point agarose, with or without IAM (Methods). Plates were imaged after two additional days of culture. Inset on top: Quantification of the average pixel intensity of mCherry expression in cells shows that mCherry inhibition depends on distance from Sender-Receiver region. Error bars denote standard deviation of the four images making up each column in the mosaic.
Figure 3:
Figure 3:. Sender-Receiver cells sense their population density and regulate survival accordingly.
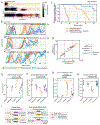
(A-B) Sender-Receiver and Sender-Receiver-PIN2 cells perform quorum sensing. For both plots, cells were seeded at different densities and induction conditions, with either of the two auxins (saturating signaling) or their precursors (to allow quorum sensing). mCherry fluorescence was assayed after two days as a reporter of auxin sensing. Inset: Cells in B express the transporter PIN2, which actively exports auxin. Data were fitted onto an inverted Michaelis-Menten’s function on log scale (see Figure S2B for fitted parameters, Method). (C) Sender-Receiver-PIN2 cells sense population size per unit volume. Cells were grown for two days at 6 different densities for each media volume, and cultured on a rocker for better mixing. (D) Sender-Receiver-PIN2 triggers cell death at high population density. Cells were seeded at different confluence levels, grown for four days in media with 50 μg/ml blasticidin and IAM, IAA, or no auxin. Error bars indicate standard deviation from triplicates.
Figure 4:
Figure 4:. Paradoxical architecture reduces susceptibility to cheater mutations.
(A) In the paradoxical architecture, the same signal inhibits growth (red pathway) and death (green pathway). This can produce a window of auxin concentrations leading to positive net growth (light blue region). Without mutation, the paradoxical and negative feedback circuits operate similarly around a stable equilibrium point of large population size (solid black dots, left panels). Mutations that eliminate sensing make both death and growth independent of auxin concentration (right panels), which selects against mutations in the paradoxical circuit due to negative net growth. (B) In the paradoxical circuit implementation, auxin regulates growth through BlastR (upper path), and also regulates apoptosis via iCasp9 (lower path), each with distinct fluorescent protein readouts and a small molecule (blasticidin and AP1903) as a control switch. (C) The full paradoxical circuit can be encoded as a single open reading frame, with distinct proteins separated by T2A peptides (grey squares). (D) Paradaux cells respond to auxin in a biphasic manner. Cells were seeded at about 1/8 confluence (grey dashed line) and pretreated with NAA for one day, then treated with combinations of NAA, blasticidin (20 μg/ml) and AP1903 (50 nM) for another 3 days, and imaged. Pink, green, and blue dots show the mean and standard deviation of three replicates in the presence of AP1903, blasticidin, or both, respectively. Solid red and green lines indicate fits of these data to the model. Purple dashed lines indicate predictions for the fully operational circuit based on the green and red curves. Dotted purple line is the model prediction when the synergy term is included. (E) Different classes of behavior can occur in different parameter regimes. We simulated auxin-dependent growth in different parameter regimes and identified five distinct regimes (indicated schematically as insets). Using this classification, we numerically analyzed and sorted growth curves for each concentration of blasticidin and AP1903 (central plot). The blue dot indicates the blasticidin and AP1903 concentrations used in the time-lapse movie analysis (Figure 5). The grey region indicates curves that could not be classified into one of these categories (0.68% of total, see Figure S4F and STAR Methods). (F). For each expression level, we analyzed the percent of blasticidin-AP1903 concentrations that generate paradoxical behavior, similar to panel E. Optimizing the expression and ratio of BlastR and iCasp9 can widen the paradoxical regime. (G) Dynamic simulations show the Paradoxical Control circuit provides evolutionary robustness. For the negative feedback system, βC and βsyn are set to zero. Mutated strains were simulated with auxin (A) fixed to zero, representing sensing deficient mutations. On day 25, 50, 75 and 100, mutant cells (1% of the population cap) were introduced into the system. These mutants take over in the negative feedback circuit (top) but not the paradoxical circuit (bottom). Dashed line indicates carrying capacity.
Figure 5:
Figure 5:. The paradoxical circuit allows mutationally robust population control.
(A) Composite kymograph of long-term cultures with no control (100 μM NAM; upper panel), negative feedback (100 μM NAM and 50 μg/ml blasticidin; middle panel), or paradoxical feedback (100 μM NAM, 50 μg/ml blasticidin, and 50 nM AP1903; lower panel), from movie set 3. For visualization, the images were analyzed using ilastik and 30-pixel-wide strips from each timepoint were combined to make the kymograph. (B) Population dynamics for the three movie sets conditions reveal delayed mutational escape for the paradoxical circuit (shaded envelopes represent the standard deviation across 12, 25, and 36 stage positions, for each movie set respectively). Solid dots indicate escape events, defined by cells exceeding 95% confluency and not returning below that threshold for the duration of the movie. Black arrows indicate late cheating isolates that are similarly denoted with arrows in (G). (C) Kaplan-Meier estimate (Kishore, Goel and Khanna, 2010) of survival (no mutant escape) for movies in (B). Samples in movie set 2 that ended earlier were treated as dropouts. The samples under paradoxical feedback retain population control significantly longer than those under negative feedback (p<0.005, log-rank test). (D-F) Isolates were treated with 10 μM NAA, or nothing, for two days prior to flow cytometry assay for mCherry and mGFP fluorescence, co-expressed with BlastR and iCasp9 respectively. Bars represent standard deviation from triplicates (D and E), or bootstrapping (F, n=9). (D) Isolates from all long term cultures show correlated BlastR and iCasp9 expressions. (E) Isolates from negative feedback, but not paradoxical feedback, showed upregulation in BlastR, compared to control. (F) Isolates from negative feedback showed diminished dynamic range compared to both control and paradoxical groups. (G and H) BlastR and iCasp9 expression levels affect survival rates across different conditions. Cells were seeded in 96-well imaging plates with IAA or standard media for one day, and the second drug, blasticidin (G) or AP1903 (H), was added. Samples were then imaged to estimate confluency at day 4. For each isolate, survival rates were normalized to the group with no second drug. The black arrows in (G) highlight the isolates that cheated at the final days in movie set 3, black arrows in (B). Values and errors were calculated by bootstrapping (n=6, Methods). (I) How the paradoxical architecture, but not negative feedback, eliminates cells that lose the ability to sense auxin (schematic).

Similar articles

Cited by

References

    1. Bacchus W et al. (2012) ‘Synthetic two-way communication between mammalian cells’, Nature biotechnology, 30(10), pp. 991–996. - PubMed
    1. Balagaddé FK et al. (2005) ‘Long-Term Monitoring of Bacteria Undergoing Programmed Population Control in a Microchemostat’, Science, pp. 137–140. doi: 10.1126/science.1109173. - DOI - PubMed
    1. Basner J (2017) ‘Impact Analysis of “Berman HM et al., (2000), The Protein Data Bank”’, RCSB Protein Data Bank, doi: 10.2210/rcsb_pdb/pdb-cit-anal-2017. - DOI
    1. Berg S et al. (2019) ‘ilastik: interactive machine learning for (bio)image analysis’, Nature methods, doi: 10.1038/S41592-019-0582-9. - DOI - PubMed
    1. Bier E and De Robertis EM (2015) ‘BMP gradients: A paradigm for morphogen-mediated developmental patterning’, Science, pp. aaa5838–aaa5838. doi: 10.1126/science.aaa5838. - DOI - PubMed

Publication types

Substances