iBet uBet web content aggregator. Adding the entire web to your favor.


Link to original content: https://pubmed.ncbi.nlm.nih.gov/34747694
Early evolution of beetles regulated by the end-Permian deforestation - PubMed Skip to main page content
U.S. flag

An official website of the United States government

Dot gov

The .gov means it’s official.
Federal government websites often end in .gov or .mil. Before sharing sensitive information, make sure you’re on a federal government site.

Https

The site is secure.
The https:// ensures that you are connecting to the official website and that any information you provide is encrypted and transmitted securely.

Access keys NCBI Homepage MyNCBI Homepage Main Content Main Navigation
. 2021 Nov 8:10:e72692.
doi: 10.7554/eLife.72692.

Early evolution of beetles regulated by the end-Permian deforestation

Affiliations

Early evolution of beetles regulated by the end-Permian deforestation

Xianye Zhao et al. Elife. .

Abstract

The end-Permian mass extinction (EPME) led to a severe terrestrial ecosystem collapse. However, the ecological response of insects-the most diverse group of organisms on Earth-to the EPME remains poorly understood. Here, we analyse beetle evolutionary history based on taxonomic diversity, morphological disparity, phylogeny, and ecological shifts from the Early Permian to Middle Triassic, using a comprehensive new dataset. Permian beetles were dominated by xylophagous stem groups with high diversity and disparity, which probably played an underappreciated role in the Permian carbon cycle. Our suite of analyses shows that Permian xylophagous beetles suffered a severe extinction during the EPME largely due to the collapse of forest ecosystems, resulting in an Early Triassic gap of xylophagous beetles. New xylophagous beetles appeared widely in the early Middle Triassic, which is consistent with the restoration of forest ecosystems. Our results highlight the ecological significance of insects in deep-time terrestrial ecosystems.

Keywords: beetle; carbon cycle; deforestation; disparity; diversity; evolutionary biology; extinction; none.


Conflict of interest statement

XZ, YY, MC, EY, JC, EJ, XZ, BW No competing interests declared

Figures

Figure 1.
Figure 1.. Examples of Permian beetles.
(A and B) Tshekardocoleidae, Moravocoleus permianus Kukalová, 1969, photograph and reconstruction. (C and D) Permocupedinae, Permocupes sojanensis Ponomarenko, 1969, photograph and reconstruction. (E) Tshekardocoleidae, Sylvacoleus richteri Ponomarenko, 1963, elytra photograph. (F) Taldycupedinae, Taldycupes reticulatus Ponomarenko, 1969, elytra photograph. Scale bars represent 1 mm.
Figure 2.
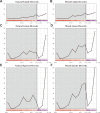
Figure 2.. Diversity of Coleoptera from the Early Permian to Middle Triassic.
Natural taxa and mixed taxa (natural taxa and formal taxa) are counted at family, genus, and species levels separately. (A) Family-level diversity of natural taxa. (B) Family-level diversity of mixed taxa. (C) Genus-level diversity of natural taxa. (D) Genus-level diversity of mixed taxa. (E) Species-level diversity of natural taxa. (F) Species-level diversity of mixed taxa. Abbreviations: P1, Early Permian; P2, Middle Permian; P3, Late Permian; T1, Early Triassic; T2, Middle Triassic.
Figure 2—figure supplement 1.
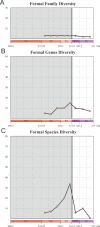
Figure 2—figure supplement 1.. Diversity of Coleoptera formal groups from the Early Permian to Middle Triassic.
(A) Family-level diversity. (B) Genus-level diversity. (C) Species-level diversity. Abbreviations: P1, Early Permian; P2, Middle Permian; P3, Late Permian; T1, Early Triassic; T2, Middle Triassic.
Figure 3.
Figure 3.. Ecological shifts of Coleoptera from the Early Permian to Middle Triassic.
(A) Simplified phylogeny of Coleoptera from the Early Permian to Middle Triassic. Thick lines indicate the known extent of the fossil record. The branches representing stem groups are shown in red. The ‘dead clade walking’ pattern is symbolized by the dashed line. For details of the phylogenetic analysis, see Figure 3—figure supplement 1. (B) Genus percentage of xylophagous groups from the Early Permian to Middle Triassic. Yellow graded band represents the ‘coal gap’.
Figure 3—figure supplement 1.
Figure 3—figure supplement 1.. Strict consensus tree of three most parsimonious trees of Coleoptera.
Tree length = 199, consistency index (CI) = 0.800, retention index (RI) = 0.747. Numbers on branches denote bootstrap frequencies; bootstrap frequencies below 50 are not shown. The unambiguous apomorphies are mapped on the tree.
Figure 4.
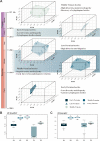
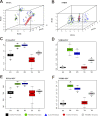
Figure 4.. Morphospace comparisons of Coleoptera from the Early Permian to Middle Triassic.
(A) Morphospace three-dimensional (3D) plot ordinated by principal coordinates analysis (PcoA), maximum observable rescale distance (MORD) matrices, based on species-level dataset. (B and C) Disparity comparisons ordinated by PcoA, MORD matrices, based on species-level dataset, proxy by pov and sov. Abbreviations: pov, product of variance; sov, sum of variance; P1, Early Permian; P2, Middle Permian; P3, Late Permian; T1, Early Triassic; T2, Middle Triassic.
Figure 4—figure supplement 1.
Figure 4—figure supplement 1.. Morphospace comparisons of Coleoptera from the Early Permian to Middle Triassic, maximum observable rescale distance (MORD) matrices, proxy by pov and sov.
(A, D, and G) Morphospace three-dimensional (3D) plot and disparity comparisons ordinated by non-metric multidimensional scaling (NMDS), based on genus-level dataset. (B, E ,and H) Morphospace 3D plot and disparity comparisons ordinated by principal coordinates analysis (PcoA), based on species-level dataset. (C, F, and I) Morphospace 3D plot and disparity comparisons ordinated by NMDS, based on species-level dataset. Abbreviations: pov, product of variance; sov, sum of variance; P1, Early Permian; P2, Middle Permian; P3, Late Permian; T1, Early Triassic; T2, Middle Triassic. In the morphospace 3D plot, morphospace occupation of Early Triassic taxa is highlighted by red area.
Figure 4—figure supplement 2.
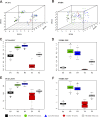
Figure 4—figure supplement 2.. Morphospace comparisons of Coleoptera from the Early Permian to Middle Triassic, based on genus-level disparity analyses of generalized Euclidean distance (GED) matrices, proxy by pov and sov.
(A, C, and E) Morphospace three-dimensional (3D) plot and disparity comparisons ordinated by principal coordinates analysis (PcoA). (B, D, and F) Morphospace 3D plot and disparity comparisons ordinated by non-metric multidimensional scaling (NMDS). Abbreviations: pov, product of variance; sov, sum of variance; P1, Early Permian; P2, Middle Permian; P3, Late Permian; T1, Early Triassic; T2, Middle Triassic. In the morphospace 3D plot, morphospace occupation of Early Triassic taxa is highlighted by red area.
Figure 4—figure supplement 3.
Figure 4—figure supplement 3.. Morphospace comparisons of Coleoptera from the Early Permian to Middle Triassic, based on species-level disparity analyses of generalized Euclidean distance (GED) matrices, proxy by pov and sov.
(A, C, and E) Morphospace three-dimensional (3D) plot and disparity comparisons ordinated by principal coordinates analysis (PcoA). (B, D, and F) Morphospace 3D plot and disparity comparisons ordinated by non-metric multidimensional scaling (NMDS). Abbreviations: pov, product of variance; sov, sum of variance; P1, Early Permian; P2, Middle Permian; P3, Late Permian; T1, Early Triassic; T2, Middle Triassic. In the morphospace 3D-plot, morphospace occupation of Early Triassic taxa is highlighted by red area.
Figure 4—figure supplement 4.
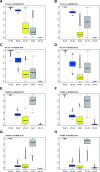
Figure 4—figure supplement 4.. Permutation tests with sample size corrected (maximum observable rescale distance [MORD]).
(A–D) Permutation tests for principal coordinates analysis (PcoA) results. (E–H) Permutation tests for non-metric multidimensional scaling (NMDS) results. Each box represents a distribution of the proportion greater than the observed value of the test statistic in the null distribution. Grey line highlights the value of 0.025 or 0.975. Difference lower than 0.025 represents the disparity of the former lower than the latter significantly, and the condition of the difference higher than 0.975 was inverse. Abbreviations: G, genus database; S, species database; pov, product of variance; sov, sum of variance; P1, Early Permian; P2, Middle Permian; P3, Late Permian; T1, Early Triassic; T2, Middle Triassic.
Figure 4—figure supplement 5.
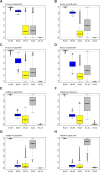
Figure 4—figure supplement 5.. Permutation tests with sample size corrected (generalized Euclidean distance [GED]).
(A–D) Permutation tests for principal coordinates analysis (PcoA) results. (E–H) Permutation tests for non-metric multidimensional scaling (NMDS) results. Each box represents a distribution of the proportion greater than the observed value of the test statistic in the null distribution. Grey line highlights the value of 0.025 or 0.975. Difference lower than 0.025 represents the disparity of the former lower than the latter significantly, and the condition of the difference higher than 0.975 was inverse. Abbreviations: G, genus database; S, species database; pov, product of variance; sov, sum of variance; P1, Early Permian; P2, Middle Permian; P3, Late Permian; T1, Early Triassic; T2, Middle Triassic.
Figure 4—figure supplement 6.
Figure 4—figure supplement 6.. Disparity comparison and permutation tests with sample size corrected, under ordination method of principal coordinates analysis (PcoA), assuming that the age of the Grès à Voltzia specimens is Early Triassic.
Left: results based on maximum observable rescale distance (MORD) matrix. Right: results based on generalized Euclidean distance (GED) matrix. (A, B, E, and F) Disparity comparison. (C, D, G, and H) Permutation tests with sample size corrected. Abbreviations: G, genus database; S, species database; pov, product of variance; sov, sum of variance; P1, Early Permian; P2, Middle Permian; P3, Late Permian; T1, Early Triassic; T2, Middle Triassic.
Figure 4—figure supplement 7.
Figure 4—figure supplement 7.. Disparity comparison and permutation tests with sample size corrected, under ordination method of non-metric multidimensional scaling (NMDS), assuming that the age of the Grès à Voltzia specimens is Early Triassic.
Left: results based on maximum observable rescale distance (MORD) matrix. Right: results based on generalized Euclidean distance (GED) matrix. (A, B, E, and F) Disparity comparison. (C, D, G, and H) Permutation tests with sample size corrected. Abbreviations: G, genus database; S, species database; pov, product of variance; sov, sum of variance; P1, Early Permian; P2, Middle Permian; P3, Late Permian; T1, Early Triassic; T2, Middle Triassic.
Figure 4—figure supplement 8.
Figure 4—figure supplement 8.. Shepard ‘goodness-of-fit’ stress plot.
(A) Result for maximum observable rescale distance (MORD) matrix of genus database. (B) Result for MORD matrix of species database. (C) Result for generalized Euclidean distance (GED) matrix of genus database. (D) Result for GED matrix of species database. Stress and R2 value indicate a good result of ordinations.

Similar articles

Cited by

References

    1. Bar-On YM, Phillips R, Milo R. The biomass distribution on Earth. PNAS. 2018;115:6506–6511. doi: 10.1073/pnas.1711842115. - DOI - PMC - PubMed
    1. Barnes BD, Sclafani JA, Zaffos A. Dead clades walking are a pervasive macroevolutionary pattern. PNAS. 2021;118:e2019208118. doi: 10.1073/pnas.2019208118. - DOI - PMC - PubMed
    1. Belovsky GE, Slade JB. Insect herbivory accelerates nutrient cycling and increases plant production. PNAS. 2000;97:14412–14417. doi: 10.1073/pnas.250483797. - DOI - PMC - PubMed
    1. Benca JP, Duijnstee IAP, Looy CV. UV-B-induced forest sterility: Implications of ozone shield failure in Earth’s largest extinction. Science Advances. 2018;4:e1700618. doi: 10.1126/sciadv.1700618. - DOI - PMC - PubMed
    1. Benton MJ, Newell AJ. Impacts of global warming on Permo-Triassic terrestrial ecosystems. Gondwana Research. 2014;25:1308–1337. doi: 10.1016/j.gr.2012.12.010. - DOI

Publication types

Grants and funding

The funders had no role in study design, data collection and interpretation, or the decision to submit the work for publication.