iBet uBet web content aggregator. Adding the entire web to your favor.


Link to original content: https://pubmed.ncbi.nlm.nih.gov/33618348/
Genomic insights into the formation of human populations in East Asia - PubMed Skip to main page content
U.S. flag

An official website of the United States government

Dot gov

The .gov means it’s official.
Federal government websites often end in .gov or .mil. Before sharing sensitive information, make sure you’re on a federal government site.

Https

The site is secure.
The https:// ensures that you are connecting to the official website and that any information you provide is encrypted and transmitted securely.

Access keys NCBI Homepage MyNCBI Homepage Main Content Main Navigation
. 2021 Mar;591(7850):413-419.
doi: 10.1038/s41586-021-03336-2. Epub 2021 Feb 22.

Genomic insights into the formation of human populations in East Asia

Chuan-Chao Wang #  1   2   3   4 Hui-Yuan Yeh #  5 Alexander N Popov #  6 Hu-Qin Zhang #  7 Hirofumi Matsumura  8 Kendra Sirak  9   10 Olivia Cheronet  11 Alexey Kovalev  12 Nadin Rohland  9 Alexander M Kim  9   13 Swapan Mallick  9   10   14   15 Rebecca Bernardos  9 Dashtseveg Tumen  16 Jing Zhao  7 Yi-Chang Liu  17 Jiun-Yu Liu  18 Matthew Mah  9   14   15 Ke Wang  19 Zhao Zhang  9 Nicole Adamski  9   15 Nasreen Broomandkhoshbacht  9   15 Kimberly Callan  9   15 Francesca Candilio  11 Kellie Sara Duffett Carlson  11 Brendan J Culleton  20 Laurie Eccles  21 Suzanne Freilich  11 Denise Keating  11 Ann Marie Lawson  9   15 Kirsten Mandl  11 Megan Michel  9   15 Jonas Oppenheimer  9   15 Kadir Toykan Özdoğan  11 Kristin Stewardson  9   15 Shaoqing Wen  22 Shi Yan  23 Fatma Zalzala  9   15 Richard Chuang  17 Ching-Jung Huang  17 Hana Looh  24 Chung-Ching Shiung  17 Yuri G Nikitin  25 Andrei V Tabarev  26 Alexey A Tishkin  27 Song Lin  7 Zhou-Yong Sun  28 Xiao-Ming Wu  7 Tie-Lin Yang  7 Xi Hu  7 Liang Chen  29 Hua Du  30 Jamsranjav Bayarsaikhan  31 Enkhbayar Mijiddorj  32 Diimaajav Erdenebaatar  32 Tumur-Ochir Iderkhangai  32 Erdene Myagmar  16 Hideaki Kanzawa-Kiriyama  33 Masato Nishino  34 Ken-Ichi Shinoda  33 Olga A Shubina  35 Jianxin Guo  36 Wangwei Cai  37 Qiongying Deng  38 Longli Kang  39 Dawei Li  40 Dongna Li  41 Rong Lin  41 Nini  39 Rukesh Shrestha  42 Ling-Xiang Wang  42 Lanhai Wei  36 Guangmao Xie  43   44 Hongbing Yao  45 Manfei Zhang  42 Guanglin He  36 Xiaomin Yang  36 Rong Hu  36 Martine Robbeets  46 Stephan Schiffels  19 Douglas J Kennett  47 Li Jin  42 Hui Li  42 Johannes Krause  48 Ron Pinhasi  49 David Reich  50   51   52   53
Affiliations

Genomic insights into the formation of human populations in East Asia

Chuan-Chao Wang et al. Nature. 2021 Mar.

Abstract

The deep population history of East Asia remains poorly understood owing to a lack of ancient DNA data and sparse sampling of present-day people1,2. Here we report genome-wide data from 166 East Asian individuals dating to between 6000 BC and AD 1000 and 46 present-day groups. Hunter-gatherers from Japan, the Amur River Basin, and people of Neolithic and Iron Age Taiwan and the Tibetan Plateau are linked by a deeply splitting lineage that probably reflects a coastal migration during the Late Pleistocene epoch. We also follow expansions during the subsequent Holocene epoch from four regions. First, hunter-gatherers from Mongolia and the Amur River Basin have ancestry shared by individuals who speak Mongolic and Tungusic languages, but do not carry ancestry characteristic of farmers from the West Liao River region (around 3000 BC), which contradicts theories that the expansion of these farmers spread the Mongolic and Tungusic proto-languages. Second, farmers from the Yellow River Basin (around 3000 BC) probably spread Sino-Tibetan languages, as their ancestry dispersed both to Tibet-where it forms approximately 84% of the gene pool in some groups-and to the Central Plain, where it has contributed around 59-84% to modern Han Chinese groups. Third, people from Taiwan from around 1300 BC to AD 800 derived approximately 75% of their ancestry from a lineage that is widespread in modern individuals who speak Austronesian, Tai-Kadai and Austroasiatic languages, and that we hypothesize derives from farmers of the Yangtze River Valley. Ancient people from Taiwan also derived about 25% of their ancestry from a northern lineage that is related to, but different from, farmers of the Yellow River Basin, which suggests an additional north-to-south expansion. Fourth, ancestry from Yamnaya Steppe pastoralists arrived in western Mongolia after around 3000 BC but was displaced by previously established lineages even while it persisted in western China, as would be expected if this ancestry was associated with the spread of proto-Tocharian Indo-European languages. Two later gene flows affected western Mongolia: migrants after around 2000 BC with Yamnaya and European farmer ancestry, and episodic influences of later groups with ancestry from Turan.


Conflict of interest statement

Competing interests

The authors declare no competing interests.

Figures
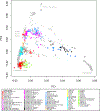
Extended Data Figure 1|
Extended Data Figure 1|. Principal Component Analysis (PCA).
Projection of ancient samples onto PCA dimensions 1 and 2 defined by East Asians, Europeans, Siberians and Native Americans.
Extended Data Figure 2|
Extended Data Figure 2|. Principal Component Analysis (PCA).
(A) PCA dimensions 1 and 2 defined by present-day East Asians, Europeans, Siberians and Native Americans. (B) PCA dimensions 1 and 2 defined by present-day East Asian groups with the little West Eurasian mixture.
Extended Data Figure 3|
Extended Data Figure 3|. Neighbour-joining tree of present-day East Eurasians based on Fst distances using the Human Origin dataset.
(a) The branch length is shown in Fst distance, (b) Version where internal branches are all shown as having the same length for better visualization.
Extended Data Figure 4|
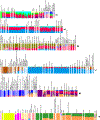
Extended Data Figure 4|. ADMIXTURE plot at K=15 using the Human Origin dataset.
We grouped the populations roughly into six groups from A to F based on geographic and genetic affinity. (A) populations mainly from Africa (yellow), America (magenta), West Eurasia (dark green and light brown) and Oceania (light magenta); (B) populations mainly from Mongolia (blue) and Siberia (purple); (C) populations mainly from southern China and Southeast Asia (light blue); (D) populations mainly from the Tibetan Plateau (olive) and Neolithic Yellow River Basin (red); (E) mainly Han Chinese around China (light blue and red); (F) populations mainly from the Amur River Basin (blue and red) and northeast Asia.
Extended Data Figure 5|
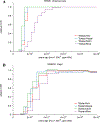
Extended Data Figure 5|. Estimates of population split times.
(A) Cross-coalescence rates for selected population pairs. We ran MSMC for four pairs of populations: Tibetan-Ami, Tibetan-Atayal, Tibetan-Ulchi and Tibetan-Mixe. We used one individuals from each population in this analysis. The modern genomic data for those individuals are from the Simons Genome Diversity Project. The times are calculated based on the mutation rate and generation time specified on the x-axis. (B) Cross-coalescence rates for selected population pairs. Same analysis as in Figure SI3–1, but using MSMC2 instead of MSMC, and using two individuals per population except for the Tibetan-Atayal pair, where we used only one.
Extended Data Figure 6|
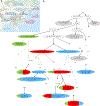
Extended Data Figure 6|. Admixture graph model.
(This is the same as Figure 2 except that we show the fitted genetic drifts on each lineage.) We used all available sites in the 1240K dataset, restricting to transversions only to confirm that the same model fit (Supplementary Information section 3). We started with a skeleton tree that fits the data for Denisova, Mbuti, Onge, Tianyuan and Luxembourg Loschbour and one admixture event. We grafted on Mongolia East Neolithic, Upper Yellow River Late Neolithic farmers, Liangdao2, Japan Jomon, Nepal Chokhopani, Taiwan Hanben, and West Liao River Late Neolithic farmers in turn, adding them consecutively to all possible edges in the tree and retaining only graph solutions that provided no differences of |Z|<3 between fitted and estimated statistics (maximum |Z|=2.95 here). We used the MSMC and MSMC2 relative population split time estimates to constrain models. Deep splits are not well constrained due to minimal availability of Upper Paleolithic East Asian data. (a) Locations and dates of the East Asian individuals used in model fitting, with colours indicating whether the majority ancestry is from the hypothesized coastal expansion (green), interior expansion south (red), and interior expansion north. The map is based on the “Google Map Layer” from ArcGIS Online Basemaps (Map data ©2020 Google). (b) In the model visualization, we color lineages modelled as deriving entirely from one of these expansions, and also color populations according to ancestry proportions. Dashed lines represent admixture (proportions are marked), and we show the amount of genetic drift on each lineage in units of FST x 1000.
Extended Data Figure 7|
Extended Data Figure 7|. Shared genetic drift among Tibetans, measured by f3 (X, Y; Mbuti).
Lighter colors indicate more shared drift. Lahu groups with the Southeast Asian Cluster probably due to substantial admixture. The Tibetan_Yajiang are geographically in the Tibeto-Burman Corridor but group with Core Tibetans, presumably reflecting less genetic admixture from people of the Southeast Asian Cluster.
Figure 1:
Figure 1:. Overview.
(a) Locations, sample size (in brackets) and temporal distribution of newly reported ancient individuals, plotted using the “Google Map Layer” from ArcGIS Online Basemaps (Map data ©2020 Google). (b) Plot of first and second Principal Components defined in an analysis of East Asians with minimal West Eurasian-related mixture.
Figure 2:
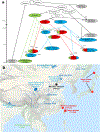
Figure 2:. Model of deep population relationships.
We start with a skeleton tree with one admixture event that when run on all SNPs fits the data for Denisova, Mbuti, Onge, Tianyuan and Loschbour according to qpGraph. We grafted on Mongolia East Neolithic, Upper Yellow River Late Neolithic farmers, Liangdao2, Japan Jomon, Nepal Chokhopani, Taiwan Hanben, and West Liao River Late Neolithic farmers, adding them consecutively to all possible edges and retaining only graphs that provided no differences of |Z|<3 between fitted and estimated statistics (maximum |Z|=2.95 here). We used MSMC and MSMC2 relative population split time estimates to constrain models. (a) We colour lineages modelled as from the hypothesized coastal expansion (green), interior southern expansion (red), or interior northern expansion (blue), and populations according to ancestry proportions. Dashed lines represent admixture (proportions marked). (b) Locations and dates of East Asians used in model fitting, with colours indicating the majority ancestry source, are plotted using the “Google Map Layer” from ArcGIS Online Basemaps (Map data ©2020 Google).
Figure 3:
Figure 3:. Estimates of mixture proportions using qpAdm.
(a) qpAdm modelling of Yellow River farmer (blue) and Liangdao-related ancestry (orange) in present-day East Asians, with numbers from Online Table 22, and plotted using the “Google Map Layer” from ArcGIS Online Basemaps (Map data ©2020 Google). (b) Mongolians and Xinjiang. As sources we explored all possible subsets of Mongolia_East_N, Afanasievo, WSHG, Sintashta_MLBA, Turkmenistan_Gonur_BA_1, and Han Chinese, adding all groups to the reference set when not used as sources, and identifying parsimonious models (fewest numbers of sources) that fit at P>0.05 based on the Hotelling T2 test implemented in qpAdm (Online Table 25). These P-values do not incorporate any correction for multiple hypothesis testing. * indicates parsimonious models that only pass at P>0.01. ** indicates cases where multiple equally parsimonious models pass at P>0.05 so we can not determine whether the West Eurasian-related source was Afanasievo, WSHG, or Sintashta_MLBA (we plot the model with the largest p-value). Bars show ancestry proportions, and time spans are unions of all samples. We do not visualize results from singleton outliers.

Similar articles

Cited by

References

    1. Cavalli-Sforza LL The Chinese human genome diversity project. Proc. Natl. Acad. Sci. USA 95, 11501–11503 (1998). - PMC - PubMed
    1. HUGO Pan-Asian SNP Consortium. Mapping human genetic diversity in Asia. Science 326, 1541–1545 (2009). - PubMed
    1. Haak W, et al. Massive migration from the steppe was a source for Indo-European languages in Europe. Nature 522, 207–211 (2015). - PMC - PubMed
    1. Allentoft ME, et al. Population genomics of Bronze Age Eurasia. Nature 522,167–172 (2015). - PubMed
    1. de Barros Damgaard P, et al.. 137 ancient human genomes from across the Eurasian steppes. Nature 557, 369–374 (2018). - PubMed

Publication types