iBet uBet web content aggregator. Adding the entire web to your favor.


Link to original content: https://pubmed.ncbi.nlm.nih.gov/33273469/
Structure of voltage-modulated sodium-selective NALCN-FAM155A channel complex - PubMed Skip to main page content
U.S. flag

An official website of the United States government

Dot gov

The .gov means it’s official.
Federal government websites often end in .gov or .mil. Before sharing sensitive information, make sure you’re on a federal government site.

Https

The site is secure.
The https:// ensures that you are connecting to the official website and that any information you provide is encrypted and transmitted securely.

Access keys NCBI Homepage MyNCBI Homepage Main Content Main Navigation
. 2020 Dec 3;11(1):6199.
doi: 10.1038/s41467-020-20002-9.

Structure of voltage-modulated sodium-selective NALCN-FAM155A channel complex

Affiliations

Structure of voltage-modulated sodium-selective NALCN-FAM155A channel complex

Yunlu Kang et al. Nat Commun. .

Abstract

Resting membrane potential determines the excitability of the cell and is essential for the cellular electrical activities. The NALCN channel mediates sodium leak currents, which positively adjust resting membrane potential towards depolarization. The NALCN channel is involved in several neurological processes and has been implicated in a spectrum of neurodevelopmental diseases. Here, we report the cryo-EM structure of rat NALCN and mouse FAM155A complex to 2.7 Å resolution. The structure reveals detailed interactions between NALCN and the extracellular cysteine-rich domain of FAM155A. We find that the non-canonical architecture of NALCN selectivity filter dictates its sodium selectivity and calcium block, and that the asymmetric arrangement of two functional voltage sensors confers the modulation by membrane potential. Moreover, mutations associated with human diseases map to the domain-domain interfaces or the pore domain of NALCN, intuitively suggesting their pathological mechanisms.


Conflict of interest statement

The authors declare no competing interests.

Figures

Fig. 1
Fig. 1. Overall structure of NALCN and FAM155A complex.
a Topology of NALCN and FAM155A subunits. Helices are shown as cylinders, unmodeled disordered regions are shown as dashed lines. The phospholipid bilayer is shown as gray layers. CTD C-terminal intracellular domain of NALCN. CIH CTD interacting helix of NALCN. CRD cysteine-rich domain of FAM155A. Plus signs represent positively charged residues on S4 segments. Key residues on the predicted selectivity filter are indicated. b Side view of NALCN and FAM155A complex. Sugar moieties are shown as black sticks, side chains of cysteine residues participating in disulfide bond formation are shown as spheres. Sulfur atoms of disulfide bonds were colored in gold and Cα and Cβ atoms were colored the same as each domain. The approximate boundaries of phospholipid bilayer are indicated as gray thick lines. c A 90° rotated view compared to b. d The arrangement of the NALCN transmembrane domain illustrated in the top view. For clarity, only voltage sensors and S6 segments are shown. The angles between adjacent voltage sensors are labeled. Angular measurements were based on the center of mass positions (red spheres) of each domain. e, f Structural mapping of disease-related mutations in NALCN. For clarity, only two nonadjacent domains are shown in each panel. The Cα atoms of disease-related residues are shown as red spheres.
Fig. 2
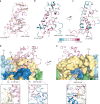
Fig. 2. Structure of FAM155A CRD and its interactions with NALCN.
a Structure of FAM155A CRD (residues 188–200, 226–262, and 267–389). Disulfide bonds are shown as yellow sticks. b Structural mapping of conserved residues of FAM155 family members, generated by ConSurf. c A 90° rotated view compared to b. d Interactions between FAM155A and NALCN. FAM155A is shown as a cartoon. NALCN is shown as a surface. Key interaction regions are boxed and zoomed in the close-up views below. e A 180° rotated view compared to d.
Fig. 3
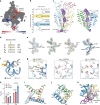
Fig. 3. Structure of the pore domain of NALCN.
a A cut-open side view of NACLN and FAM155A complex. The surface electrostatic potential is calculated by APBS. The ion permeation pathway is shown as a yellow line. b Pore profile of NALCN channel shows two constrictions. c The ion permeation pathway of the pore domain, calculated with HOLE, is shown as color dots. Purple, green, and red dots represent pore radii >2.8 Å, 1.4–2.8 Å, and <1.4 Å, respectively. d Sequence alignment of the residues around the selectivity filter of rat NALCN. Residues that participate in ion permeation are highlighted in yellow. Residues for predicted selectivity filter are indicated with an arrow. e Densities of the selectivity filter of each repeat, shown as gray mesh, are contoured at 3.5 σ. f Side view of the structural comparison of domain IV between CaV1.1 (gray) and NALCN (blue). Key residues are shown as sticks. The yellow box indicates the approximate position of the high field strength layer of the selectivity filter. g Structural comparisons of the selectivity filter of NALCN, NaV1.4 (PDB: 6AGF), and CaV1.1 (PDB: 5GJV). Key residues are shown as sticks. h, Relative ion permeability ratios (PNa/PX) of NALCN and its mutants. Data are presented as mean ± s.d., n = 3 biologically independent cells. Two-tailed unpaired Student’s t-test was applied, and P-values were indicated in the figure. P < 0.05 was considered statistically significant. NS no significance. Source data are provided as a Source Data file. i Structure of S6 segments. π-bulges are highlighted in red. j Top view of the intracellular gate, hydrophobic residues forming the narrowest constrictions are shown as sticks. k Side view of the intracellular exit for sodium. The gray surface represents the calculated ion permeation pathway.
Fig. 4
Fig. 4. Voltage sensors of NALCN at the depolarized state.
a Sequence alignment of S2 and S4 segments. The sequences of rat NALCN, human NALCN, fruit fly NCA, nematode NCA1, NCA2, human CaV3.1, rabbit CaV1.1, human NaV1.2, and human NaV1.4 were aligned using PROMALS3D. Residues forming the charge-transfer center are shaded in gray. The conserved negative or polar E1 and E4 on S2 segments, F3 on S2 segments, and positive R1-R6 on S4 segments are highlighted in red, brown, and blue, respectively. b Structures of four VSDs in NALCN. Gating charges and charge-transfer center residues are shown as sticks. 310 helices are colored in pink.
Fig. 5
Fig. 5. Structure of NALCN intracellular domains.
a III–IV linker has extensive polar interactions with CTD and S6 segments in NALCN. The interacting residues are shown as sticks. The gray surface represents the calculated ion permeation pathway. b Structure of CTD and CIH of NALCN. Helices are shown as cylinders. c Interactions between CTD and CIH of NALCN. The interacting residues are shown as sticks.

Similar articles

Cited by

References

    1. Chua HC, Wulf M, Weidling C, Rasmussen LP, Pless SA. The NALCN channel complex is voltage sensitive and directly modulated by extracellular calcium. Sci. Adv. 2020;6:eaaz3154. doi: 10.1126/sciadv.aaz3154. - DOI - PMC - PubMed
    1. Ren D. Sodium leak channels in neuronal excitability and rhythmic behaviors. Neuron. 2011;72:899–911. doi: 10.1016/j.neuron.2011.12.007. - DOI - PMC - PubMed
    1. Nash HA, Scott RL, Lear BC, Allada R. An unusual cation channel mediates photic control of locomotion in Drosophila. Curr. Biol. 2002;12:2152–2158. doi: 10.1016/S0960-9822(02)01358-1. - DOI - PubMed
    1. Lu B, et al. The neuronal channel NALCN contributes resting sodium permeability and is required for normal respiratory rhythm. Cell. 2007;129:371–383. doi: 10.1016/j.cell.2007.02.041. - DOI - PubMed
    1. Cochet-Bissuel M, Lory P, Monteil A. The sodium leak channel, NALCN, in health and disease. Front. Cell Neurosci. 2014;8:132. doi: 10.3389/fncel.2014.00132. - DOI - PMC - PubMed

Publication types