iBet uBet web content aggregator. Adding the entire web to your favor.


Link to original content: https://pubmed.ncbi.nlm.nih.gov/32669693
Bacterial chemolithoautotrophy via manganese oxidation - PubMed Skip to main page content
U.S. flag

An official website of the United States government

Dot gov

The .gov means it’s official.
Federal government websites often end in .gov or .mil. Before sharing sensitive information, make sure you’re on a federal government site.

Https

The site is secure.
The https:// ensures that you are connecting to the official website and that any information you provide is encrypted and transmitted securely.

Access keys NCBI Homepage MyNCBI Homepage Main Content Main Navigation
. 2020 Jul;583(7816):453-458.
doi: 10.1038/s41586-020-2468-5. Epub 2020 Jul 15.

Bacterial chemolithoautotrophy via manganese oxidation

Affiliations

Bacterial chemolithoautotrophy via manganese oxidation

Hang Yu et al. Nature. 2020 Jul.

Abstract

Manganese is one of the most abundant elements on Earth. The oxidation of manganese has long been theorized1-yet has not been demonstrated2-4-to fuel the growth of chemolithoautotrophic microorganisms. Here we refine an enrichment culture that exhibits exponential growth dependent on Mn(II) oxidation to a co-culture of two microbial species. Oxidation required viable bacteria at permissive temperatures, which resulted in the generation of small nodules of manganese oxide with which the cells associated. The majority member of the culture-which we designate 'Candidatus Manganitrophus noduliformans'-is affiliated to the phylum Nitrospirae (also known as Nitrospirota), but is distantly related to known species of Nitrospira and Leptospirillum. We isolated the minority member, a betaproteobacterium that does not oxidize Mn(II) alone, and designate it Ramlibacter lithotrophicus. Stable-isotope probing revealed 13CO2 fixation into cellular biomass that was dependent upon Mn(II) oxidation. Transcriptomic analysis revealed candidate pathways for coupling extracellular manganese oxidation to aerobic energy conservation and autotrophic CO2 fixation. These findings expand the known diversity of inorganic metabolisms that support life, and complete a biogeochemical energy cycle for manganese5,6 that may interface with other major global elemental cycles.


Conflict of interest statement

Completing interests The authors declare no competing financial interests.

Figures

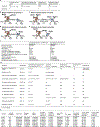
Extended Data Fig. 1 |
Extended Data Fig. 1 |. Effect of temperature, anti-bacterials, and Mn(II)Cl2 on biological Mn(II)CO3 oxidation.
a, Incubation temperature influences oxidation. A optimum between 34 °C and 40 °C was observed, but above these temperatures oxidation was inhibited. In contrast, non-biological reactions would generally be predicted to continue to increase in rate with increasing temperature. b, Sensitivity of Mn(II) oxidation to the presence of either of two antibiotics, or to prior pasteurisation before extended incubation at 32 °C. c, When amended to active co-cultures at concentrations >2.0 mM, MnCl2 appeared to inhibit MnCO3 oxidation when an active culture containing 2.2 mM unreacted MnCO3 was used as the inoculum. Number of points for each experimental condition represent independent cultivation experiments.
Extended Data Fig. 2 |
Extended Data Fig. 2 |. Mn(II) oxidation and growth by the co-culture.
a, DNA yield of the two species co-culture incubated in MOPS-buffered basal media in the absence of Mn(II) substrate. No statistically significant changes in the mean DNA yields (p=0.06, day 0 vs 10; p=0.70, day 10 vs 21; p=0.20, day 0 vs 21; two-tailed t-test with equal variance) are observed over the incubation period. b, c, Exponential increase in Bacteria and biomass yields in a Mn(II)-oxidising culture, which is coupled to exponential increases Mn(II) oxidation (same culture analysed in Fig. 2). Bacteria was measured via 16S rRNA gene copies using a general Bacteria probe in quantitative PCR; points represent 3 technical replicates. Biomass was measure via DNA yield from same culture volumes. d, Exponential increases in Mn(II) oxidation (Fig. 2a) and DNA yields by this same culture (1 mM nitrate replicate 1, c) correlate. Similar relationships were observed in samples from independent cultivation experiments (n=2). e-l, Kinetics of Mn(II) oxidation by the co-culture in basal media; two phases of exponential Mn(II) oxidation were observed. e-g, Basal media with 1 mM nitrate (n=4; for replicate 1, see bd and Fig. 2). h-l, Basal media with 1 mM ammonia (n=5). m, Exponential growth of Species A and Species B paralleled Mn(II) oxidation in basal medium with 1 mM ammonia as N source (1 mM ammonia replicate 5, l), rather than 1 mM nitrate. n, Linear relationship between cell growth and the amount of Mn(II) oxidised (1 mM ammonia replicate 5, l and m). Values in n were normalised by subtracting the initial cell number and Mn oxide concentrations at the onset of the experiment, and negative values after normalisation were excluded from the analysis. All data points included in the line fits are used to calculate the doubling times (Td), unless otherwise noted by x symbols.
Extended Data Fig. 3 |
Extended Data Fig. 3 |. Properties of the refined co-culture.
a, Estimations of the relative ratio between Species A and Species B. *Slow-growing microbes, in particular Species A (which also has a smaller cell volume than Species B or Escherichia coli) could have lower number of ribosomes, resulting in lower signal intensity from rRNA-targeted fluorescent probes, relative to the fluorescent signal from DNA stain DAPI. The two species together account for 99.7% of assigned sequence reads (Supplementary Table 1). The two species together account for 97.54% of the sequence reads in the metagenome (panel f). §The two species together account for 99.576% (s.d. = 0.005%, n=7) of the rRNA sequence reads and 100.1700% (s.d. = 0.0005%, n=7) of the non-rRNA sequence reads in the co-culture metatranscriptomes (panel h). b-e, Possible metabolic interactions that may be occurring between Species A (orange) and Species B (blue). f, Genome statistics for Species A and Species B. g, Observed rates and yields of Mn(II) oxidation by the co-culture, in comparison to the literature values reported for other physiologically or phylogenetically related lithotrophs or metal-active heterotrophs. ||Conversion estimate based on Escherichia coli biomass of 2.8⋅10−13 g dry cell weight per cell, of which 55% is protein. Co-culture values correspond to results from the single independent culture with nitrate as N source for which extensive data on both oxidation kinetics and growth (genome copies) were collected. h, Transcriptome statistics for 7 co-cultures sampled at different degrees of Mn(II) oxidation.
Extended Data Fig. 4 |
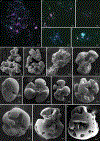
Extended Data Fig. 4 |. Microscopy of Mn oxide nodules formed by the co-culture.
a–e, Epifluorescence microscopy reveals distribution of cells of Species A and Species B associated with dissolved Mn oxide nodules. DAPI (blue) was used to stain DNA, in addition to applying species-specific FISH probes targeting the 16S rRNA of Species A (magenta) and Species B (green). Probe fluorescence for Species A was both dim and faded rapidly, but was associated with the cells that otherwise appear in photomicrographs to only be DAPI stained. No third species is present, as observed in independent cultivation experiments (n=2), and confirmed via independent methods (Extended Data Fig. 3a). Scanning electron micrographs of, f, g, Mn(II)CO3 substrate and, h-p, Mn oxide nodules harvested from liquid cultures. Representative nodules are from independent cultivation experiments (n=4).
Extended Data Fig. 5 |
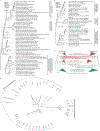
Extended Data Fig. 5 |. Phylogenetic analyses on Species A.
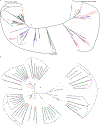
a, 16S rRNA gene phylogram, based on a Bayesian analysis of 1532 aligned nucleotide positions. NCBI taxonomic classifications are used, and sequences shown are all from the phylum Nitrospirae. The names and known physiologies for the previously described genera in this phylum are shown on the right. NCBI accession numbers for 16S rRNA sequences are included in the node names. Source environment for the sequences are shown in brackets. b, Multilocus phylogram, based on a Bayesian analysis of 5036 aligned amino acid positions concatenated from 120 bacterial protein markers. GTDB taxonomic classifications are used, and sequences shown are from the phylum Nitrospirota/Nitrospirota_A. The names and known physiologies for the previously described classes in this phylum are shown on the right. NCBI accession numbers for genome assemblies are included in the node names. For both a and b, the dots on the branches indicate posterior probabilities greater than 0.80. c, Phylogenetic analyses of the phylum Nitrospirae (Nitrospirota) limited to only those species having reconstructed genomes yield a different topology from that observed in panel a and Fig. 3a. Bayesian phylogram based on 1532 aligned 16S rRNA nucleotide positions (left); multilocus Bayesian phylogram, based on 5036 aligned amino acid positions of 120 concatenated bacterial protein markers (right). Sequences clustering within the three previously described classes within this phylum are collapsed into separate nodes. d, Protein sequence phylogeny of dihydroxy-acid and 6-phosphogluconate dehydratases. Sequences were selected based on a previous study, with the addition of homologs found in Nitrospira inopinata, Leptospirillum ferriphilum and Species A (red). All 770 aligned amino acid positions were used in the maximum likelihood analysis. Protein accession numbers from the NCBI database or gene IDs from the IMG database of the 3 new sequences are shown in parentheses. Black dots on the branches represent bootstrap values equal to 100%. While dihydroxy-acid dehydratase and 6-phosphogluconate dehydratase are homologous, they form separate clusters phylogenetically as reported. The homologs in Nitrospirae all belong to the dihydroxy-acid dehydratase clade, therefore are unlikely candidates for 6-phosphogluconate dehydratase activity and function in the ED pathway. All scale bars = evolutionary distance (0.1 substitutions-per-site average).
Extended Data Fig. 6 |
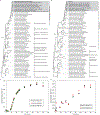
Extended Data Fig. 6 |. Phylogenetic analyses and aerobic heterotrophic growth of isolated Species B.
a, 16S rRNA gene phylogram, based on a Bayesian analysis of 1532 aligned nucleotide positions. NCBI taxonomic classifications are used, with sequences selected from the class Betaproteobacteria. The genus Ramlibacter, consistently identified in two phylogenetic approaches, is shaded in grey, with Species B in bold. Source environments for the species in Ramlibacter are shown in brackets. The order and family classifications are included to the right separated by a semicolon. The black dots on the branches indicate posterior probabilities great than 0.90. b, Multilocus phylogram, based on a maximum-likelihood analysis of 5035 aligned amino acid positions concatenated from 120 bacterial protein markers. GTDB taxonomic classifications are used, and sequences shown are from the order Betaproteobacteriales. The GTDB family classifications are included to the right of species names. NCBI accession numbers for 16S rRNA sequences or the genome assemblies are included after the species names. The black dots on the branches indicate bootstrap values greater than 90%. Scale bars = evolutionary distance (0.1 substitutions-per-site average). c, d, Kinetics of Species B growth basal media with either c, 5 g/L of tryptone (n=3 biological replicates), or d, 10 mM acetate (n=2 biological replicates).
Extended Data Fig. 7 |
Extended Data Fig. 7 |. Phylogenetic analyses of cytochrome bd oxidase subunit I and cytochrome bd-like oxidases.
Only cytochrome bd-like oxidases were identified in Species A, in contrast to other classes in the phylum Nitrospirae (Nitrospirota). a, Unrooted maximum-likelihood tree, constructed using 242 amino acid positions shared between cytochrome bd and bd-like oxidases, using RAxML (model LGF). Deduced proteins from the genome of Species A are in red, with their IMG gene IDs and clade numbering (as shown in Fig. 3b) included in brackets. Other proteins from the phylum Nitrospirae (Nitrospirota) are coloured blue, orange or brown for classes Nitrospiria, Leptospirillia, or Thermodesulfovibrionia, respectively. Cytochrome bd oxidase of Species B, with its IMG ID, is in green; it belongs to the cyanide insensitive oxidase clade in purple. b, Phylogenetic analysis of cytochrome bd-like oxidases from Species A. Unrooted maximum-likelihood tree was constructed using 242 amino acid positions shared between different clades of cytochrome bd-like oxidases. Cytochrome bd-like oxidases are assigned to different clades, based on the phylogeny and their gene cluster structures. Species A encodes 8 cytochrome bd-like oxidases (bold), representing clades I, II, IIIb, Va and Vb; clade numbering as shown in Fig. 3b are included in brackets after the IMG IDs. Black dots on branches represent bootstrap values greater than 90%. Scale bars = evolutionary distance (substitutions-per-site average).
Extended Data Fig. 8 |
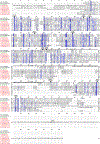
Extended Data Fig. 8 |. Sequence alignment of cytochrome bd and bd-like oxidases.
Cytochrome bd-like oxidase in Species A (sequence names starting with A, followed by their IMG gene ID and clade numbering as shown in brackets in Fig. 3b) and cytochrome bd oxidase subunit I in Species B (sequence name starting with B, followed by its IMG gene ID) are aligned to characterized cytochrome bd oxidases in Escherichia coli (sequence name starting with Eco, followed by its NCBI ID) and Geobacillus thermodenitrificans (sequence name starting with Geo, followed by its NCBI ID). Key features as revealed by structure are indicated at the top of the alignment, using E. coli protein residue numbering. The cytochrome bd oxidase subunit I sequence from Species B shows conservation of all key residues. In contrast, cytochrome bd-like oxidases in Species A do not show conservation of many key residues; instead, they are predicted to have 14 transmembrane helixes (compared to 9 in E. coli). One cytochrome bd-like oxidase in Species A has a C-terminus extension with a heme c binding motif (CXXCH).
Extended Data Fig. 9 |
Extended Data Fig. 9 |. Stable isotope probing of Mn(II)-oxidising co-culture measured using nanoSIMS.
a, Summary of stable isotope probing analysis of cells dissolved from Mn oxide nodules, either with paraformaldehyde fixation and FISH, or without (to avoid dilution with natural abundance isotopes). Cells of Species A and Species B were either identified by FISH or by elemental composition (Species B cells were observed to have higher 14N/15N ratios), and their isotopic compositions were obtained via nanoSIMS (n=the total number of cell regions of interest analysed in the nanoSIMS images). For FISH-nanoSIMS analyses, a total of 2 and 5 nanoSIMS images from single cultures incubated with either MnCO3 or Mn13CO3, respectively, were examined. For nanoSIMS analyses without paraformaldehyde fixation and FISH, a total of 3 and 17 nanoSIMS images from single cultures incubated with either MnCO3 or Mn13CO3, respectively, were examined. bu, Individual secondary ion images from nanoSIMS showing incorporation of inorganic 13C and 15N into the cells of both species (dissolved from Mn oxide nodules grown in the presence of bk, MnCO3 and 15NO3, or lu, Mn13CO3 and 15NO3.), and Species B cells could have higher 14N content than Species A. Secondary ions 12C2 (mass 24 for 12C), 13C12C (mass 25 for 13C), 14N12C (mass 26 for 14N), 15N12C (mass 27 for 15N), 32S (mass 32 for 32S) were simultaneously measured. The counts of the secondary ions are shown in brackets [minimum maximum] and displayed using the colour scale shown on the right of the images. bf and lp correspond to the top and bottom panels in Fig. 4, respectively. White arrows indicate Species B cells identified in FISH showing high 14N in nanoSIMS. v, NanoSIMS measurement of residual Mn associated with cells grown with Mn13CO3 and 15NO3, after dissolving from Mn oxide nodules. Same nanoSIMS image area was analysed as lp, except 55Mn16O (mass 71 for 55Mn) was measured (n=1 nanoSIMS image) in addition to other secondary ions. Negligible amount of Mn was found in the biomass, indicating that any remaining Mn13CO3 substrate had been completely dissolved away during sample preparation, and thus did not interfere with the 13C analyses.
Extended Data Fig. 10 |
Extended Data Fig. 10 |. Evaluations of experimental methods.
a, b, c, d, Evaluation of FISH oligonucleotide probes. Three probes (NLT499=●, BET359=○, and BET867=□) were tested in different probe combinations and formamide concentrations, using 16S rRNA gene clones of Species A (a, b) or Species B (c, d). Each point in the dissociation profile represents the mean of fluorescence intensities of at least 100 different single cells in 5 distinct microscopic fields of 1 biological replicate. Lines connect the 95% confidence intervals of the points. No interference was found when targeting either Species A or Species B with different probe combinations and formamide concentrations. RU = relative units of fluorescence intensity. e, Evaluation of ICP-MS method to measure Mn compounds with different oxidation states. Mn(II) in its various forms can be almost entirely measured in the acid-soluble fraction with little in the acid-insoluble fraction, and any increase in the acid-insoluble fraction is an indication of oxidised Mn(II). In this study, we refer to the “acid-soluble fraction” as Mn(II), and the “acid-insoluble fraction” as Mn(II) oxidised representing Mn(III/IV). See Supplementary Note 4 for more details. f, Evaluation of transcriptome analysis software kallisto. Average fragment length for RNA libraries was measured to be 230 bp. However, using 230 bp as the input parameter for fragment length caused a kallisto expression evaluation issue for genes <230 bp in length; thus, the fragment length was adjusted downward to 100 bp in order to evaluate the expression of genes <230 bp. This parameter change does not affect the overall transcript expression for genes >230 bp as seen in the correlation analysis, performed using transcriptome sample Mn03. g, h, Evaluation of quantification range and efficiency of quantitative PCR oligonucleotide probes. Three quantitative PCR oligonucleotide probes (g, Bacteria, or h, Species A or Species B specific) were tested using cloned 16S rRNA gene of either Species A (open squares, solid lines) or Species B (open triangles, dashed lines) as DNA templates. Threshold cycle (CT) versus gene copies show that all three probes had working efficiencies between 90–105% in the quantification ranges plotted. Points represent 3 technical replicates. i, j, Evaluation of specificity of quantitative PCR oligonucleotide probes. The percentage of i, Species A, and j, Species B, was estimated in reactions containing a mixture of cloned 16S rRNA genes from both Species A and Species B as DNA templates. Dashed lines represent theoretical 100% match in the expected versus measured values. The results indicate that the species-specific probes quantified their targeted species with minimal interference. Points represent 4 technical replicates.
Figure 1 |
Figure 1 |. Biooxidation of MnCO3 produces Mn oxide nodules to which two species associate.
a, After incubation, comparison of an uninoculated control flask of basal medium containing bright, unreacted MnCO3 (left), with the adherent dark oxide products generated in one that had been inoculated with viable material (right). b, c, d, e, Microscopy of Mn oxide nodules generated in agarose solidified MnCO3 media. b, After incubation of tubes inoculated with viable material, the cloud of bright MnCO3 particles was clarified towards the air exposed meniscus, concomitant with the generation of larger, discrete dark oxides (enlarged in c). d, Transmitted light micrograph of an acridine orange (nucleic acid) stained Mn oxide nodule from the same agarose tube; e, epifluorescence micrograph of the same, with surface visible biomass localized to the inner clefts; material in clefts appeared orange prior to staining. f, Scanning electron micrograph of an Mn oxide nodule produced by the co-culture. g, Epifluorescence microscopy and fluorescence in situ hybridisation using species-specific rRNA-targeted probes reveal cell distributions in dissolved Mn oxide nodules: Species A (magenta), Species B (green), all DNA stained with DAPI (blue). No third species is present, via independent methods (Extended Data Fig. 3a). Each panel represents observations made from samples of multiple independent cultivation experiments (a, n >100; b,c,d,e, n=7; f, n=4; and g, n=2).
Figure 2 |
Figure 2 |. Mn(II) oxidation coupled to co-culture growth of Species A and Species B.
a, Mn(II) oxidation rates increased exponentially over time in two distinct phases before plateauing. b, Exponential growth of Species A and Species B paralleled Mn(II) oxidation. c, Linear relationship between growth yield and the amount of Mn(II) oxidised. Symbols in b and c represent the three technical replicates for each sample. See Extended Data Fig. 2b–n for analyses on independent cultivation experiments (n=9).
Figure 3 |
Figure 3 |. Phylogenetic analysis and metabolic reconstruction of Species A (‘Ca. Manganitrophus noduliformans’).
a, Bayesian phylogram based on 1532 aligned 16S rRNA nucleotide positions. Sequences clustering within the three previously described classes within this phylum are collapsed into separate nodes. Species A clusters with not-yet-cultivated members of the Trogloglia, a distinct class within the bacterial phylum Nitrospirae (Nitrospirota). See Extended Data Fig. 5a–c for greater detail and identifiers. Scale bars = evolutionary distance (0.1 substitutions-per-site average). b, Hypothetical model of e flow from extracellular Mn(II) to the energy and anabolic systems of Species A. The oxidation is hypothesized to be mediated by several expressed outer membrane complexes (orange), with subsequent e transfers to periplasmic carriers. The bulk of e flow is towards generating proton motive force via terminal oxidases (TO, green) during O2 respiration. The remaining e- flow would be to motive force dissipating, reverse electron transport complexes (blue), generating the low-potential e carriers required for rTCA cycle mediated CO2-fixation. Gene expression values represent the mean of independent cultivation experiments (n=7). See Supplementary Table 4 for identifiers and transcript levels for each gene, and Supplementary Notes 7 and 8 for more detailed explanations of the diagrams.
Figure 4 |
Figure 4 |. Stable isotope probing of autotrophic CO2 fixation.
Cells grown in the basal medium with labelled Mn13CO3 and 15NO3 were compared to cells grown with unlabelled MnCO3 and 15NO3. a,d, Fluorescence in situ hybridisation of cells dissolved from Mn oxide nodules using species-specific rRNA-targeted probes: Species A (magenta), Species B (green), all DNA stained with DAPI (blue). b,c,e,f, Nanometre-scale secondary ion mass spectrometry reveal incorporation of 13C and 15N into cells. Coloured scale bars indicate 13C or 15N atom percent. White scale bars = 3 µm. Areas shown in b,c and e,f correspond to that in a and d, respectively. See Extended Data Fig. 9a for analyses on independent nanoSIMS images (n=5) from the same culture incubated with inorganic 13C.

Similar articles

Cited by

References

    1. Beijerinck M Oxydation des mangancarbonates durch Bakterien und Schimmelpilze. Folia Microbiol Delft (1913).
    1. Nealson KH, Tebo BM & Rosson RA Occurrence and mechanisms of microbial oxidation of manganese. Adv. Appl. Microbiol 33, 279–318 (1988).
    1. Tebo BM, Johnson HA, McCarthy JK & Templeton AS Geomicrobiology of manganese(II) oxidation. Trends Microbiol 13, 421–428 (2005). - PubMed
    1. Hansel C & Learman DR Geomicrobiology of manganese in Ehrlich’s Geomicrobiology (eds. Ehrlich HL, Newman DK & Kappler A) 401–452 (CRC Press, 2015). 10.1201/b19121. - DOI
    1. Myers CR & Nealson KH Bacterial manganese reduction and growth with manganese oxide as the sole electron acceptor. Science 240, 1319–1321 (1988). - PubMed

Publication types