iBet uBet web content aggregator. Adding the entire web to your favor.


Link to original content: https://pubmed.ncbi.nlm.nih.gov/31904150
The mechanistic target of rapamycin pathway downregulates bone morphogenetic protein signaling to promote oligodendrocyte differentiation - PubMed Skip to main page content
U.S. flag

An official website of the United States government

Dot gov

The .gov means it’s official.
Federal government websites often end in .gov or .mil. Before sharing sensitive information, make sure you’re on a federal government site.

Https

The site is secure.
The https:// ensures that you are connecting to the official website and that any information you provide is encrypted and transmitted securely.

Access keys NCBI Homepage MyNCBI Homepage Main Content Main Navigation
. 2020 Jun;68(6):1274-1290.
doi: 10.1002/glia.23776. Epub 2020 Jan 6.

The mechanistic target of rapamycin pathway downregulates bone morphogenetic protein signaling to promote oligodendrocyte differentiation

Affiliations

The mechanistic target of rapamycin pathway downregulates bone morphogenetic protein signaling to promote oligodendrocyte differentiation

Isis M Ornelas et al. Glia. 2020 Jun.

Abstract

Oligodendrocyte precursor cells (OPCs) differentiate and mature into oligodendrocytes, which produce myelin in the central nervous system. Prior studies have shown that the mechanistic target of rapamycin (mTOR) is necessary for proper myelination of the mouse spinal cord and that bone morphogenetic protein (BMP) signaling inhibits oligodendrocyte differentiation, in part by promoting expression of inhibitor of DNA binding 2 (Id2). Here we provide evidence that mTOR functions specifically in the transition from early stage OPC to immature oligodendrocyte by downregulating BMP signaling during postnatal spinal cord development. When mTOR is deleted from the oligodendrocyte lineage, expression of the FK506 binding protein 1A (FKBP12), a suppressor of BMP receptor activity, is reduced, downstream Smad activity is increased and Id2 expression is elevated. Additionally, mTOR inhibition with rapamycin in differentiating OPCs alters the transcriptional complex present at the Id2 promoter. Deletion of mTOR in oligodendroglia in vivo resulted in fewer late stage OPCs and fewer newly formed oligodendrocytes in the spinal cord with no effect on OPC proliferation or cell cycle exit. Finally, we demonstrate that inhibiting BMP signaling rescues the rapamycin-induced deficit in myelin protein expression. We conclude that mTOR promotes early oligodendrocyte differentiation by suppressing BMP signaling in OPCs.

Keywords: BMP signaling; FKBP12; Id2; OPC; mTOR.


Figures

FIGURE 1
FIGURE 1
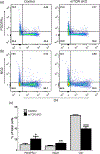
mTOR is critical for differentiation of early OPCs to late OPCs. Spinal cords from control and mTOR cKO mice at PND10 were dissociated and cell suspensions were analyzed by flow cytometry. PDGFRα and NG2 were used as markers for early OPCs and O4 as a marker for late OPCs and immature oligodendrocytes. (a) Representative dot plots showing PDGFRα+ and O4+ populations in control and mTOR cKO. (b) Representative dot plots showing NG2+ and O4+ populations in control and mTOR cKO. (c) Quantification of the percentage of PDGFRα+, NG2+ and O4+ cells in spinal cord of control and mTOR cKO animals. Values expressed as mean ± SEM in percentage of live cells. (n ≥ 5/genotype) *p < .05; **p < .01; ***p < .001
FIGURE 2
FIGURE 2
mTOR deletion does not alter cell proliferation or cell cycle exit. (a) Quantification of phospho-histone H3 (pH 3) immunofluorescence in spinal cord sections from control and mTOR cKO mice at PND10. Values expressed as mean ± SEM. (n = 3/genotype). (b) Cell cycle analysis of PDGFRα+ cells by flow cytometry. Spinal cords from control and mTOR cKO mice at PND10 were dissociated and stained with anti-PDGFRα and Hoescht. PDGFRα+ cell population was selected by gating, and cell cycle phase was determined based on the DNA content by Hoescht staining. (n = 3 controls, n = 5 mTOR cKO) (c) Representative graph showing sorting efficiency of PDGFRα+ cells. Dissociated cells from spinal cords at PND10 were incubated with PDGFRα antibody conjugated to magnetic microbeads and subjected to magnetic-activated cell sorting. Positive (dark gray) and negative (light gray) cell fractions were analyzed by flow cytometry to determine percentage of PDGFRα+ cells in each fraction. Eighty-three percent of the positive cell fraction is PDGFRα+; 37% of the negative fraction is PDGFRα+. (d) mRNA expression of genes involved in cell cycle regulation. Expression of cyclin D1, cyclin B1, Cdk1, E2f1 by quantitative real-time PCR in sorted PDGFRα+ cells from PND10 spinal cords. Data represent at least three independent experiments. In each experiment, cells were pooled from 3 to 4 mice/genotype. Values expressed as mean ± SEM
FIGURE 3
FIGURE 3
Loss of mTOR results in fewer newly formed oligodendrocytes in spinal cord. Enpp6 in situ hybridization in ventral spinal cord of (a) control and (b) mTOR cKO mice at PND7 (c) Quantification of Enpp6+ cells in ventral white matter fields for control (n = 3) and mTOR cKO (n = 4). (d) Enpp6 expression in sorted PDGFRα+ cells by quantitative real-time PCR at PND10 (n = 3). Values expressed as mean ± SEM. *p ≤ .05; ***p ≤ .001
FIGURE 4
FIGURE 4
Loss of mTOR increases Id2 exclusively in the PDGFRα + population in the spinal cord. (a) Expression of Myrf, Sox10, Sox17, Tcf4, Id4, Id2 by quantitative real-time PCR in whole spinal cord at PND7 (n = 6 animals/genotype). (b) Expression of Sox10, Sox5, Tcf4, Id4, Id2 by quantitative real-time PCR in sorted PDGFRα+ cells from PND10 spinal cords. Data represent five independent experiments. In each experiment, cells were pooled from 3 to 4 mice/genotype. (c) Expression of Myrf, Sox10, Tcf4, Id4, Id2 by quantitative real-time PCR in sorted O4+ cells from PND10 spinal cords. Data represent three independent experiments. In each experiment, cells were pooled from 3 to 4 mice/genotype. (d) Representative Western blots and quantification of Id2 expression in primary rat OPCs after 24 hr of differentiation ±15 nM rapamycin (n = 5). Western blot analysis (e) and quantification (f) of Id2 expression in control and mTOR cKO spinal cords at PND10 (n = 3). Protein was extracted from dissociated whole spinal cords. All values expressed as mean ± SEM. *p < .05; **p < .01
FIGURE 5
FIGURE 5
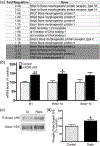
BMP signaling is upregulated after mTOR loss. (a) Gene expression analysis in TGFβ-BMP signaling pathway using TGFβ-BMP RT2-Profiler PCR Array. mRNA was extracted from PDGFRα+ cells sorted from spinal cord of control and mTOR cKO mice at PND10. mRNA was combined from three independent sorting experiments. In each experiment, cells were pooled from 3 to 4 mice/genotype. (b) Expression of Id1, Bmpr-1a and Bmpr-1b by quantitative real-time PCR in sorted PDGFRα+ cells from PND10 spinal cords. Data represent four independent experiments. In each experiment, cells were pooled from 3 to 4 mice/genotype. Values expressed as mean ± SEM. (c) Representative western blots and (d) quantification of phosphorylated and total Smad1/5/8 in primary rat OPCs after 24 hr of differentiation ±15 nM rapamycin (n = 8). Values expressed as mean ± SEM. **p < .01; *p < .05
FIGURE 6
FIGURE 6
mTOR inhibition alters transcriptional machinery at Id2 promoter. ChIP assays performed in primary rat OPCs after 72 hr of differentiation ±15 nM rapamycin. (a) Representative PCR gels and (b) quantification of Id2 promoter bound to immunoprecipitated proteins (n = 3). Smad, Sip1, HDAC1, and HDAC2 were immunoprecipitated and Id2 promoter region was PCR amplified from bound chromatin. Input DNA was used as positive control. Values expressed as mean ± SEM. **p < .01
FIGURE 7
FIGURE 7
FKBP12 is reduced in mTOR cKO. Western blot analysis (a) and quantification (b) of FKBP12 expression in control and mTOR cKO spinal cords at PND10 (n = 3). Protein was extracted from dissociated whole spinal cords. Values expressed as mean ± SEM. *p < .05
FIGURE 8
FIGURE 8
Inhibition of BMP receptor signaling rescues rapamycin-induced reduction in myelin proteins. CG-4 cells were differentiated for days ± rapamycin and/or BMP receptor inhibitor K02288. Following treatment protein was harvested and western blot performed to detect myelin proteins (a) MBP and (b) MOG. Representative western blot and quantification are shown (n = 4). Values expressed as mean ± SEM. *p < .05
FIGURE 9
FIGURE 9
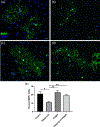
Inhibition of BMP ligands rescues rapamycin-induced reduction in MBP-positive oligodendroglia. Primary OPCs were differentiated for 3 days under (a) control conditions, or treated with (b) 10 nM rapamycin, (c) 500 ng/ml noggin, or (d) rapamycin and noggin. Cells were fixed and stained for MBP. Representative images and quantification (e) are shown (n = 6 over two independent rat litters for OPC prep). Scale bar 20 μm. Values expressed as mean ± SEM. *p < .05; **p < .01
FIGURE 10
FIGURE 10
mTOR regulates BMP signaling in differentiation OPCs. Schematic illustrating mTOR regulation of BMP signaling in spinal cord OPCs. In control OPCs, mTOR either directly or indirectly inhibits BMPs and BMPR1. mTOR promotes FKBP12 expression and formation of the regulatory complex at the Id2 promoter. Compared to control cells, mTOR cKO OPCs have decreased expression of FKBP12, increased BMP signaling at the receptor, and increased downstream phosphorylation of Smad1/5/8. When mTOR is inhibited, the levels of Sip1 and HDAC2 bound to the Id2 promoter are reduced, resulting in increased expression of Id2, an inhibitor of oligodendrocyte differentiation

Similar articles

Cited by

References

    1. Baroti T, Zimmermann Y, Schillinger A, Liu L, Lommes P, Wegner M, & Stolt CC (2016). Transcription factors Sox5 and Sox6 exert direct and indirect influences on oligodendroglial migration in spinal cord and forebrain. Glia, 64(1), 122–138. 10.1002/glia.22919 - DOI - PubMed
    1. Bercury KK, Dai J, Sachs HH, Ahrendsen JT, Wood TL, & Macklin WB (2014). Conditional ablation of raptor or rictor has differential impact on oligodendrocyte differentiation and CNS myelination. The Journal of Neuroscience, 34(13), 4466–4480. 10.1523/JNEUROSCI.4314-13.2014 - DOI - PMC - PubMed
    1. Bujalka H, Koenning M, Jackson S, Perreau VM, Pope B, Hay CM, … Emery B (2013). MYRF is a membrane-associated transcription factor that autoproteolytically cleaves to directly activate myelin genes. PLoS Biology, 11(8), e1001625 10.1371/journal.pbio.1001625 - DOI - PMC - PubMed
    1. Carr TD, DiGiovanni J, Lynch CJ, & Shantz LM (2012). Inhibition of mTOR suppresses UVB-induced keratinocyte proliferation and survival. Cancer Prevention Research (Philadelphia, PA), 5(12), 1394–1404. 10.1158/1940-6207.CAPR-12-0272-T - DOI - PMC - PubMed
    1. Chen XS, Zhang YH, Cai QY, & Yao ZX (2012). ID2: A negative transcription factor regulating oligodendroglia differentiation. Journal of Neuroscience Research, 90(5), 925–932. 10.1002/jnr.22826 - DOI - PubMed

Publication types