Maize sugary enhancer1 (se1) is a gene affecting endosperm starch metabolism
- PMID: 31548423
- PMCID: PMC6789923
- DOI: 10.1073/pnas.1902747116
Maize sugary enhancer1 (se1) is a gene affecting endosperm starch metabolism
Abstract
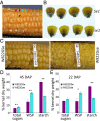
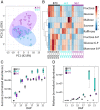
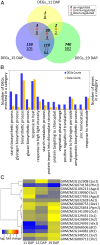
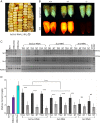
sugary enhancer1 (se1) is a naturally occurring mutant allele involved in starch metabolism in maize endosperm. It is a recessive modifier of sugary1 (su1) and commercially important in modern sweet corn breeding, but its molecular identity and mode of action remain unknown. Here, we developed a pair of near-isogenic lines, W822Gse (su1-ref/su1-ref se1/se1) and W822GSe (su1-ref/su1-ref Se1/Se1), that Mendelize the se1 phenotype in an su1-ref background. W822Gse kernels have lower starch and higher water soluble polysaccharide and sugars than W822GSe kernels. Using high-resolution genetic mapping, we found that wild-type Se1 is a gene Zm00001d007657 on chromosome 2 and a deletion of this gene causes the se1 phenotype. Comparative metabolic profiling of seed tissue between these 2 isolines revealed the remarkable difference in carbohydrate metabolism, with sucrose and maltose highly accumulated in the mutant. Se1 is predominantly expressed in the endosperm, with low expression in leaf and root tissues. Differential expression analysis identified genes enriched in both starch biosynthesis and degradation processes, indicating a pleiotropic regulatory effect of se1 Repressed expression of Se1 and Su1 in RNA interference-mediated transgenic maize validates that deletion of the gene identified as Se1 is a true causal gene responsible for the se1 phenotype. The findings contribute to our understanding of starch metabolism in cereal crops.
Keywords: maize; starch metabolism; sugary enhancer1; sugary1.
Copyright © 2019 the Author(s). Published by PNAS.
Conflict of interest statement
The authors declare no conflict of interest.
Figures


Similar articles
-
Current models for starch synthesis and the sugary enhancer1 (se1) mutation in Zea mays.Plant Physiol Biochem. 2004 Jun;42(6):457-64. doi: 10.1016/j.plaphy.2004.05.008. Plant Physiol Biochem. 2004. PMID: 15246058 Review.
-
Genetic Perturbation of the Starch Biosynthesis in Maize Endosperm Reveals Sugar-Responsive Gene Networks.Front Plant Sci. 2022 Feb 8;12:800326. doi: 10.3389/fpls.2021.800326. eCollection 2021. Front Plant Sci. 2022. PMID: 35211133 Free PMC article.
-
Functions of heteromeric and homomeric isoamylase-type starch-debranching enzymes in developing maize endosperm.Plant Physiol. 2010 Jul;153(3):956-69. doi: 10.1104/pp.110.155259. Epub 2010 May 6. Plant Physiol. 2010. PMID: 20448101 Free PMC article.
-
The Zea mays mutants opaque-2 and opaque-7 disclose extensive changes in endosperm metabolism as revealed by protein, amino acid, and transcriptome-wide analyses.BMC Genomics. 2011 Jan 18;12:41. doi: 10.1186/1471-2164-12-41. BMC Genomics. 2011. PMID: 21241522 Free PMC article.
-
Maize opaque mutants are no longer so opaque.Plant Reprod. 2018 Sep;31(3):319-326. doi: 10.1007/s00497-018-0344-3. Epub 2018 Jul 5. Plant Reprod. 2018. PMID: 29978299 Free PMC article. Review.
Cited by
-
Multi-layer molecular analysis reveals distinctive metabolomic and transcriptomic profiles of different sweet corn varieties.Front Plant Sci. 2024 Aug 19;15:1453031. doi: 10.3389/fpls.2024.1453031. eCollection 2024. Front Plant Sci. 2024. PMID: 39224849 Free PMC article.
-
Central Roles of ZmNAC128 and ZmNAC130 in Nutrient Uptake and Storage during Maize Grain Filling.Genes (Basel). 2024 May 23;15(6):663. doi: 10.3390/genes15060663. Genes (Basel). 2024. PMID: 38927600 Free PMC article.
-
Sweet corn association panel and genome-wide association analysis reveal loci for chilling-tolerant germination.Sci Rep. 2024 May 11;14(1):10791. doi: 10.1038/s41598-024-61797-7. Sci Rep. 2024. PMID: 38734751 Free PMC article.
-
NAKED ENDOSPERM1, NAKED ENDOSPERM2, and OPAQUE2 interact to regulate gene networks in maize endosperm development.Plant Cell. 2023 Dec 21;36(1):19-39. doi: 10.1093/plcell/koad247. Plant Cell. 2023. PMID: 37795691 Free PMC article.
-
Maize kernel development.Mol Breed. 2021 Jan 3;41(1):2. doi: 10.1007/s11032-020-01195-9. eCollection 2021 Jan. Mol Breed. 2021. PMID: 37309525 Free PMC article. Review.
References
-
- Bahaji A., et al. , Starch biosynthesis, its regulation and biotechnological approaches to improve crop yields. Biotechnol. Adv. 32, 87–106 (2014). - PubMed
-
- Smith A. M., Denyer K., Martin C., The synthesis of the starch granule. Annu. Rev. Plant Physiol. Plant Mol. Biol. 48, 67–87 (1997). - PubMed
-
- Hannah L. C., Starch synthesis in the maize endosperm. Maydica 50, 497–506 (2005).
-
- Kim K. N., Fisher D. K., Gao M., Guiltinan M. J., Molecular cloning and characterization of the amylose-extender gene encoding starch branching enzyme IIB in maize. Plant Mol. Biol. 38, 945–956 (1998). - PubMed
Publication types
MeSH terms
Substances
Associated data
- Actions
- Actions
LinkOut - more resources
Full Text Sources


