iBet uBet web content aggregator. Adding the entire web to your favor.


Link to original content: https://pubmed.ncbi.nlm.nih.gov/31043639
Goth migration induced changes in the matrilineal genetic structure of the central-east European population - PubMed Skip to main page content
U.S. flag

An official website of the United States government

Dot gov

The .gov means it’s official.
Federal government websites often end in .gov or .mil. Before sharing sensitive information, make sure you’re on a federal government site.

Https

The site is secure.
The https:// ensures that you are connecting to the official website and that any information you provide is encrypted and transmitted securely.

Access keys NCBI Homepage MyNCBI Homepage Main Content Main Navigation
. 2019 May 1;9(1):6737.
doi: 10.1038/s41598-019-43183-w.

Goth migration induced changes in the matrilineal genetic structure of the central-east European population

Affiliations

Goth migration induced changes in the matrilineal genetic structure of the central-east European population

I Stolarek et al. Sci Rep. .

Abstract

For years, the issues related to the origin of the Goths and their early migrations in the Iron Age have been a matter of hot debate among archaeologists. Unfortunately, the lack of new independent data has precluded the evaluation of the existing hypothesis. To overcome this problem, we initiated systematic studies of the populations inhabiting the contemporary territory of Poland during the Iron Age. Here, we present an analysis of mitochondrial DNA isolated from 27 individuals (collectively called the Mas-VBIA group) excavated from an Iron Age cemetery (dated to the 2nd-4th century A.D.) attributed to Goths and located near Masłomęcz, eastern Poland. We found that Mas-VBIA has similar genetic diversity to present-day Asian populations and higher diversity than that of contemporary Europeans. Our studies revealed close genetic links between the Mas-VBIA and two other Iron Age populations from the Jutland peninsula and from Kowalewko, located in western Poland. We disclosed the genetic connection between the Mas-VBIA and ancient Pontic-Caspian steppe groups. Similar connections were absent in the chronologically earlier Kowalewko and Jutland peninsula populations. The collected results seem to be consistent with the historical narrative that assumed that the Goths originated in southern Scandinavia; then, at least part of the Goth population moved south through the territory of contemporary Poland towards the Black Sea region, where they mixed with local populations and formed the Chernyakhov culture. Finally, a fraction of the Chernyakhov population returned to the southeast region of present-day Poland and established the archaeological formation called the "Masłomęcz group".


Conflict of interest statement

The authors declare no competing interests.

Figures

Figure 1
Figure 1
Geographical distribution of the archaeological cultures in Europe in the (a) LN/EBA: green, Yamnaya Culture 3300–2300 BC|pink, Corded Ware Culture 2900–2350 BC|yellow, Bell Beaker Culture 2900–1800 BC|orange, Corded Ware/Bell Beaker Culture|violet, Unetice Culture 2300–1600 BC; (b) BA/IA: green, Nordic Bronze Age 1700–500 BC|yellow, Hallstatt Culture 800–500 BC|orange, Hallstatt Culture Core|light green, Pomeranian Culture 700–300 BC|red, Jastorf Culture 600–100 BC|violet, Western Baltic Kurgans Culture 650–50BC; (c) IA prior to migrations period: green, Nordic Bronze Age 1700–500 BC|yellow, La Tene Culture 450–50 BC|light green, Przeworsk Culture 300 BC – 500 AD|red, Jastorf Culture 600–100 BC|violet, Western Baltic Kurgans Culture 650–50 BC|brown, Oksywie Culture 200 BC – 100 AD. Europe map by Roke, retrieved from https://commons.wikimedia.org/wiki/Category:Blank_maps_of_Europe#/media/File:BlankMap-Europe-v3.png, used under Creative Commons Attribution-ShareAlike 3.0 Unported (https://creativecommons.org/licenses/by-sa/3.0/deed.en), modified with Corel Draw ver. 12.0.
Figure 2
Figure 2
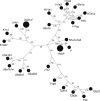
Median Joining Network of 27 individuals from Mas-VBIA based on full mtDNA sequences. Each node corresponds to a haplotype determined for a unique mtDNA sequence. Numbers in brackets show numbers of nucleotide differences between haplotypes. Stars mark haplotypes represented by two individuals with identical mtDNA sequence.
Figure 3
Figure 3
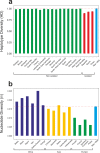
Intrapopulation genetic diversity estimates: (a) Haplotype Diversity; (b) Nucleotide Diversity. Red dotted line marks the estimate value of diversity of the Mas-VBIA.
Figure 4
Figure 4
Unsupervised hierarchical clustering with Ward method and Manhattan distance of haplogroup frequencies for the CEPT populations. P-values of the clusters are given as the percent of reproduced clusters based on 10,000 bootstrap replicates. Symbols indicate populations from Central Europe (squares and diamonds), Southern Scandinavia and Jutland Peninsula (circles), and East Europe/Asia (stars). Color shading of data points denotes to Hunter-Gatherers (grey), Early Neolithic (brown), Middle Neolithic (orange), Late Neolithic/Early Bronze Age (yellow), Iron Age (blue), and the present-day Central Europe Metapopulation (CEM, green). Abbreviations: Central/North European Hunter-Gatherers (HGCN), Starčevo Culture population (STA), Linearbandkeramik in Transdanubia (LBKT), Linearbandkeramik population from Central Europe (LBK), Rössen Culture (RSC), Schöningen Group (SCG), Baalberge Culture (BAC), Salzmünde Culture (SMC), Bernburg Culture (BEC), Corded Ware Culture (CWC), Bell Beaker Culture (BBC), Unetice Culture (UC), Jutland Iron Age (JIA), Kowalewko Oder and Vistula Iron Age (Kow-OVIA), Masłomęcz Vistula and Bug Iron Age (Mas-VBIA).
Figure 5
Figure 5
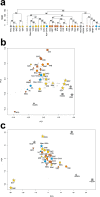
(a) Unsupervised hierarchical clustering with Ward method and Manhattan distance of haplogroup frequencies for the EPT populations. P-values of the clusters are given as the percent of reproduced clusters based on 10,000 bootstrap replicates; (b) Principal components 1 and 2 of the PCA on the haplogroup frequencies of EPT populations. Symbols indicate populations from Central Europe (squares and diamonds), Southern Scandinavia and Jutland Peninsula (circles), Iberian Peninsula (triangles), and East Europe/Asia (stars). Color shading of data points denotes to Hunter-Gatherers (grey), Early Neolithic (brown), Middle Neolithic (orange), Late Neolithic/Early Bronze Age (yellow) and Iron Age (blue). The first two principal components of the PCA display 48.4% of the total genetic variation. Each haplogroup was superimposed as component loading vectors (grey dotted lines) proportionally to their contribution. Abbreviations: Central/North European Hunter-Gatherers (HGCN), Southwestern European Hunter-Gatherers (HGSW), East European Hunter-Gatherers (HGE), Starčevo Culture population (STA), Linearbandkeramik in Transdanubia (LBKT), Linearbandkeramik population from Central Europe (LBK), Rössen Culture (RSC), Schöningen Group (SCG), Baalberge Culture (BAC), Salzmünde Culture (SMC), Bernburg Culture (BEC), Corded Ware Culture (CWC), Bell Beaker Culture (BBC), Unetice Culture (UC), Pitted Ware culture (PWC), Funnel Beaker culture (TRB), Jutland Iron Age (JIA), Cardial/Epicardial culture of the Iberian Peninsula (CAR), Portuguese Neolithic population (NPO), Neolithic population from Basque Country and Navarre (NBQ), Iberian Chalcolithic El Mirador Cave individuals (MIR), individuals from Iberian Iron Age period (IIA), Treilles Culture (TRE), Gurgy ‘Les Noisats’ group (RRBP), Bronze Age Kurgan samples from South Siberia (BAS), Bronze Age Kazakhstan (BAK), Yamnaya (YAM), Iron Age Scythian (SCY), Scytho-Siberian Pazyryk Culture (SSP), Kowalewko Oder and Vistula Iron Age (Kow-OVIA), Masłomęcz Vistula Bug Iron Age (Mas-VBIA); (c) Principal components 3 and 4 of the PCA on the haplogroup frequencies of EPT populations.
Figure 6
Figure 6
MDS plot of Slatkin’s Fst values for EPT populations. Fst values were obtained for mtDNA HVS-I region (np 16064–16400).
Figure 7
Figure 7
Geographical distribution of the archaeological cultures in contemporary Poland linked to the early migrations of the Goths: (a) formation stages of the Wielbark culture; (b) late stage of the Wielbark culture. Europe map by Roke, retrieved from https://commons.wikimedia.org/wiki/Category:Blank_maps_of_Europe#/media/File:BlankMap-Europe-v3.png, used under Creative Commons Attribution-ShareAlike 3.0 Unported (https://creativecommons.org/licenses/by-sa/3.0/deed.en), modified with Corel Draw ver. 12.0.

Similar articles

Cited by

References

    1. Mathieson I, et al. The genomic history of southeastern Europe. Nature. 2018;555:197–203. doi: 10.1038/nature25778. - DOI - PMC - PubMed
    1. Mittnik A, et al. The genetic prehistory of the Baltic Sea region. Nature communications. 2018;9:442. doi: 10.1038/s41467-018-02825-9. - DOI - PMC - PubMed
    1. Olalde I, et al. The Beaker phenomenon and the genomic transformation of northwest Europe. Nature. 2018;555:190–196. doi: 10.1038/nature25738. - DOI - PMC - PubMed
    1. Reich, D. Who We Are and How We Got Here. (Oxford University Press, 2018).
    1. Veeramah KR, et al. Population genomic analysis of elongated skulls reveals extensive female-biased immigration in Early Medieval Bavaria. Proceedings of the National Academy of Sciences of the United States of America. 2018;115:3494–3499. doi: 10.1073/pnas.1719880115. - DOI - PMC - PubMed

Publication types

Substances