A comparative study of the gut microbiota in immune-mediated inflammatory diseases-does a common dysbiosis exist?
- PMID: 30545401
- PMCID: PMC6292067
- DOI: 10.1186/s40168-018-0603-4
A comparative study of the gut microbiota in immune-mediated inflammatory diseases-does a common dysbiosis exist?
Abstract
Background: Immune-mediated inflammatory disease (IMID) represents a substantial health concern. It is widely recognized that IMID patients are at a higher risk for developing secondary inflammation-related conditions. While an ambiguous etiology is common to all IMIDs, in recent years, considerable knowledge has emerged regarding the plausible role of the gut microbiome in IMIDs. This study used 16S rRNA gene amplicon sequencing to compare the gut microbiota of patients with Crohn's disease (CD; N = 20), ulcerative colitis (UC; N = 19), multiple sclerosis (MS; N = 19), and rheumatoid arthritis (RA; N = 21) versus healthy controls (HC; N = 23). Biological replicates were collected from participants within a 2-month interval. This study aimed to identify common (or unique) taxonomic biomarkers of IMIDs using both differential abundance testing and a machine learning approach.
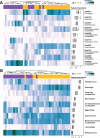
Results: Significant microbial community differences between cohorts were observed (pseudo F = 4.56; p = 0.01). Richness and diversity were significantly different between cohorts (pFDR < 0.001) and were lowest in CD while highest in HC. Abundances of Actinomyces, Eggerthella, Clostridium III, Faecalicoccus, and Streptococcus (pFDR < 0.001) were significantly higher in all disease cohorts relative to HC, whereas significantly lower abundances were observed for Gemmiger, Lachnospira, and Sporobacter (pFDR < 0.001). Several taxa were found to be differentially abundant in IMIDs versus HC including significantly higher abundances of Intestinibacter in CD, Bifidobacterium in UC, and unclassified Erysipelotrichaceae in MS and significantly lower abundances of Coprococcus in CD, Dialister in MS, and Roseburia in RA. A machine learning approach to classify disease versus HC was highest for CD (AUC = 0.93 and AUC = 0.95 for OTU and genus features, respectively) followed by MS, RA, and UC. Gemmiger and Faecalicoccus were identified as important features for classification of subjects to CD and HC. In general, features identified by differential abundance testing were consistent with machine learning feature importance.
Conclusions: This study identified several gut microbial taxa with differential abundance patterns common to IMIDs. We also found differentially abundant taxa between IMIDs. These taxa may serve as biomarkers for the detection and diagnosis of IMIDs and suggest there may be a common component to IMID etiology.
Keywords: 16S rRNA gene amplicon sequencing; Bacteria; Gut microbiota; Immune-mediated inflammatory disease; Inflammatory bowel disease; Machine learning classifiers; Multiple sclerosis; Rheumatoid arthritis; Taxonomic biomarkers.
Conflict of interest statement
Ethics approval and consent to participate
Written informed consent was obtained from patients and healthy controls prior to sample collection. The University of Manitoba’s Research Ethics Board approved this study.
Consent for publication
Not applicable.
Competing interests
The authors declare that they have no competing interests.
Publisher’s Note
Springer Nature remains neutral with regard to jurisdictional claims in published maps and institutional affiliations.
Figures


Similar articles
-
Adolescent gut microbiome imbalance and its association with immune response in inflammatory bowel diseases and obesity.BMC Microbiol. 2024 Jul 19;24(1):268. doi: 10.1186/s12866-024-03425-y. BMC Microbiol. 2024. PMID: 39030520 Free PMC article.
-
Intestinal Taxa Abundance and Diversity in Inflammatory Bowel Disease Patients: An Analysis including Covariates and Confounders.Nutrients. 2022 Jan 8;14(2):260. doi: 10.3390/nu14020260. Nutrients. 2022. PMID: 35057440 Free PMC article.
-
Dysbiotic signatures and diagnostic potential of gut microbial markers for inflammatory bowel disease in Korean population.Sci Rep. 2024 Oct 10;14(1):23701. doi: 10.1038/s41598-024-74002-6. Sci Rep. 2024. PMID: 39390011 Free PMC article.
-
The association between the gut microbiota and the inflammatory bowel disease activity: a systematic review and meta-analysis.Scand J Gastroenterol. 2016 Dec;51(12):1407-1415. doi: 10.1080/00365521.2016.1216587. Epub 2016 Aug 9. Scand J Gastroenterol. 2016. PMID: 27687331 Review.
-
Importance of Gut Microbiota in Patients with Inflammatory Bowel Disease.Nutrients. 2024 Jun 30;16(13):2092. doi: 10.3390/nu16132092. Nutrients. 2024. PMID: 38999840 Free PMC article. Review.
Cited by
-
Immune-Mediated Inflammatory Diseases and Cancer - a dangerous liaison.Front Immunol. 2024 Sep 18;15:1436581. doi: 10.3389/fimmu.2024.1436581. eCollection 2024. Front Immunol. 2024. PMID: 39359726 Free PMC article. Review.
-
A Comprehensive Review of the Triangular Relationship among Diet-Gut Microbiota-Inflammation.Int J Mol Sci. 2024 Aug 29;25(17):9366. doi: 10.3390/ijms25179366. Int J Mol Sci. 2024. PMID: 39273314 Free PMC article. Review.
-
Risk factors and clinical outcomes associated with multiple as opposed to single pathogens detected on the gastrointestinal disease polymerase chain reaction assay.Gut Pathog. 2024 Aug 30;16(1):45. doi: 10.1186/s13099-024-00638-4. Gut Pathog. 2024. PMID: 39215373 Free PMC article.
-
Healing from Within: How Gut Microbiota Predicts IBD Treatment Success-A Systematic Review.Int J Mol Sci. 2024 Aug 2;25(15):8451. doi: 10.3390/ijms25158451. Int J Mol Sci. 2024. PMID: 39126020 Free PMC article. Review.
-
Meta-analysis identifies common gut microbiota associated with multiple sclerosis.Genome Med. 2024 Jul 31;16(1):94. doi: 10.1186/s13073-024-01364-x. Genome Med. 2024. PMID: 39085949 Free PMC article.
References
-
- Wraith DC. The future of immunotherapy: a 20-year perspective. Front Immunol. 2017;8. Available from: https://www.ncbi.nlm.nih.gov/pmc/articles/PMC5712390/. Cited 15 Mar 2018. - PMC - PubMed
Publication types
MeSH terms
Substances
LinkOut - more resources
Full Text Sources
Other Literature Sources
Medical


