Global, regional, and national age-sex-specific mortality and life expectancy, 1950-2017: a systematic analysis for the Global Burden of Disease Study 2017
- PMID: 30496102
- PMCID: PMC6227504
- DOI: 10.1016/S0140-6736(18)31891-9
Global, regional, and national age-sex-specific mortality and life expectancy, 1950-2017: a systematic analysis for the Global Burden of Disease Study 2017
Erratum in
-
Department of Error.Lancet. 2019 Jun 22;393(10190):e44. doi: 10.1016/S0140-6736(19)31046-3. Lancet. 2019. PMID: 31232374 Free PMC article. No abstract available.
Abstract
Background: Assessments of age-specific mortality and life expectancy have been done by the UN Population Division, Department of Economics and Social Affairs (UNPOP), the United States Census Bureau, WHO, and as part of previous iterations of the Global Burden of Diseases, Injuries, and Risk Factors Study (GBD). Previous iterations of the GBD used population estimates from UNPOP, which were not derived in a way that was internally consistent with the estimates of the numbers of deaths in the GBD. The present iteration of the GBD, GBD 2017, improves on previous assessments and provides timely estimates of the mortality experience of populations globally.
Methods: The GBD uses all available data to produce estimates of mortality rates between 1950 and 2017 for 23 age groups, both sexes, and 918 locations, including 195 countries and territories and subnational locations for 16 countries. Data used include vital registration systems, sample registration systems, household surveys (complete birth histories, summary birth histories, sibling histories), censuses (summary birth histories, household deaths), and Demographic Surveillance Sites. In total, this analysis used 8259 data sources. Estimates of the probability of death between birth and the age of 5 years and between ages 15 and 60 years are generated and then input into a model life table system to produce complete life tables for all locations and years. Fatal discontinuities and mortality due to HIV/AIDS are analysed separately and then incorporated into the estimation. We analyse the relationship between age-specific mortality and development status using the Socio-demographic Index, a composite measure based on fertility under the age of 25 years, education, and income. There are four main methodological improvements in GBD 2017 compared with GBD 2016: 622 additional data sources have been incorporated; new estimates of population, generated by the GBD study, are used; statistical methods used in different components of the analysis have been further standardised and improved; and the analysis has been extended backwards in time by two decades to start in 1950.
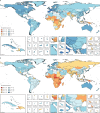
Findings: Globally, 18·7% (95% uncertainty interval 18·4-19·0) of deaths were registered in 1950 and that proportion has been steadily increasing since, with 58·8% (58·2-59·3) of all deaths being registered in 2015. At the global level, between 1950 and 2017, life expectancy increased from 48·1 years (46·5-49·6) to 70·5 years (70·1-70·8) for men and from 52·9 years (51·7-54·0) to 75·6 years (75·3-75·9) for women. Despite this overall progress, there remains substantial variation in life expectancy at birth in 2017, which ranges from 49·1 years (46·5-51·7) for men in the Central African Republic to 87·6 years (86·9-88·1) among women in Singapore. The greatest progress across age groups was for children younger than 5 years; under-5 mortality dropped from 216·0 deaths (196·3-238·1) per 1000 livebirths in 1950 to 38·9 deaths (35·6-42·83) per 1000 livebirths in 2017, with huge reductions across countries. Nevertheless, there were still 5·4 million (5·2-5·6) deaths among children younger than 5 years in the world in 2017. Progress has been less pronounced and more variable for adults, especially for adult males, who had stagnant or increasing mortality rates in several countries. The gap between male and female life expectancy between 1950 and 2017, while relatively stable at the global level, shows distinctive patterns across super-regions and has consistently been the largest in central Europe, eastern Europe, and central Asia, and smallest in south Asia. Performance was also variable across countries and time in observed mortality rates compared with those expected on the basis of development.
Interpretation: This analysis of age-sex-specific mortality shows that there are remarkably complex patterns in population mortality across countries. The findings of this study highlight global successes, such as the large decline in under-5 mortality, which reflects significant local, national, and global commitment and investment over several decades. However, they also bring attention to mortality patterns that are a cause for concern, particularly among adult men and, to a lesser extent, women, whose mortality rates have stagnated in many countries over the time period of this study, and in some cases are increasing.
Funding: Bill & Melinda Gates Foundation.
Copyright © 2018 The Author(s). Published by Elsevier Ltd. This is an Open Access article under the CC BY 4.0 license. Published by Elsevier Ltd.. All rights reserved.
Figures


Similar articles
-
Global, regional, and national under-5 mortality, adult mortality, age-specific mortality, and life expectancy, 1970-2016: a systematic analysis for the Global Burden of Disease Study 2016.Lancet. 2017 Sep 16;390(10100):1084-1150. doi: 10.1016/S0140-6736(17)31833-0. Lancet. 2017. PMID: 28919115 Free PMC article.
-
Global burden of 288 causes of death and life expectancy decomposition in 204 countries and territories and 811 subnational locations, 1990-2021: a systematic analysis for the Global Burden of Disease Study 2021.Lancet. 2024 May 18;403(10440):2100-2132. doi: 10.1016/S0140-6736(24)00367-2. Epub 2024 Apr 3. Lancet. 2024. PMID: 38582094 Free PMC article.
-
Global, regional, and national age-sex-specific mortality for 282 causes of death in 195 countries and territories, 1980-2017: a systematic analysis for the Global Burden of Disease Study 2017.Lancet. 2018 Nov 10;392(10159):1736-1788. doi: 10.1016/S0140-6736(18)32203-7. Epub 2018 Nov 8. Lancet. 2018. PMID: 30496103 Free PMC article.
-
Global, regional, and national incidence, prevalence, and years lived with disability for 301 acute and chronic diseases and injuries in 188 countries, 1990-2013: a systematic analysis for the Global Burden of Disease Study 2013.Lancet. 2015 Aug 22;386(9995):743-800. doi: 10.1016/S0140-6736(15)60692-4. Epub 2015 Jun 7. Lancet. 2015. PMID: 26063472 Free PMC article. Review.
-
Alcohol use and burden for 195 countries and territories, 1990-2016: a systematic analysis for the Global Burden of Disease Study 2016.Lancet. 2018 Sep 22;392(10152):1015-1035. doi: 10.1016/S0140-6736(18)31310-2. Epub 2018 Aug 23. Lancet. 2018. PMID: 30146330 Free PMC article. Review.
Cited by
-
Revisiting Factors Influencing Under-Five Mortality in India: The Application of a Generalised Additive Cox Proportional Hazards Model.Int J Environ Res Public Health. 2024 Sep 29;21(10):1303. doi: 10.3390/ijerph21101303. Int J Environ Res Public Health. 2024. PMID: 39457276 Free PMC article.
-
Physical activity levels and musculoskeletal disease risk in adults aged 45 and above: a cross-sectional study.BMC Public Health. 2024 Oct 25;24(1):2964. doi: 10.1186/s12889-024-20357-4. BMC Public Health. 2024. PMID: 39455997 Free PMC article.
-
Global, regional, and national burden of inflammatory bowel disease, 1990-2021: Insights from the global burden of disease 2021.Int J Colorectal Dis. 2024 Sep 7;39(1):139. doi: 10.1007/s00384-024-04711-x. Int J Colorectal Dis. 2024. PMID: 39243331 Free PMC article.
-
Cancer Burden and Attributable Risk Factors of Cancers in China: Epidemiological Insights and Comparisons With India.Cancer Control. 2024 Jan-Dec;31:10732748241276674. doi: 10.1177/10732748241276674. Cancer Control. 2024. PMID: 39240012 Free PMC article.
-
Burden of major cancer types in Almaty, Kazakhstan.Sci Rep. 2024 Sep 4;14(1):20536. doi: 10.1038/s41598-024-71449-5. Sci Rep. 2024. PMID: 39232186 Free PMC article.
References
-
- Harkness AG. Age at marriage and at death in the Roman Empire. Trans Am Philol Assoc. 1896;27:35–72.
-
- Scheidel W. Social Science Research Network; Rochester: 2009. Disease and death in the ancient city of Rome.https://papers.ssrn.com/abstract=1347510
-
- UN Sustainable development knowledge platform. https://sustainabledevelopment.un.org/sdgs
Publication types
MeSH terms
Grants and funding
- 201900/Z/16/Z/WT_/Wellcome Trust/United Kingdom
- R01 MH110163/MH/NIMH NIH HHS/United States
- SCAF/15/02/CSO_/Chief Scientist Office/United Kingdom
- 206471/Z/17/Z/WT_/Wellcome Trust/United Kingdom
- MC_UU_12026/2/MRC_/Medical Research Council/United Kingdom
- P30 AG047845/AG/NIA NIH HHS/United States
- MC_U147585819/MRC_/Medical Research Council/United Kingdom
- MC_UP_A620_1014/MRC_/Medical Research Council/United Kingdom
- WT_/Wellcome Trust/United Kingdom
- MR/R015600/1/MRC_/Medical Research Council/United Kingdom
- MR/M015084/1/MRC_/Medical Research Council/United Kingdom
- T32 HD007242/HD/NICHD NIH HHS/United States
- MC_UU_12011/1/MRC_/Medical Research Council/United Kingdom
- 201900/WT_/Wellcome Trust/United Kingdom
- 109949/Z/15/Z/WT_/Wellcome Trust/United Kingdom
- 205039/Z/16/Z/WT_/Wellcome Trust/United Kingdom
LinkOut - more resources
Full Text Sources
Miscellaneous


