iBet uBet web content aggregator. Adding the entire web to your favor.


Link to original content: https://pubmed.ncbi.nlm.nih.gov/30395604
Chromatin remodelers couple inchworm motion with twist-defect formation to slide nucleosomal DNA - PubMed Skip to main page content
U.S. flag

An official website of the United States government

Dot gov

The .gov means it’s official.
Federal government websites often end in .gov or .mil. Before sharing sensitive information, make sure you’re on a federal government site.

Https

The site is secure.
The https:// ensures that you are connecting to the official website and that any information you provide is encrypted and transmitted securely.

Access keys NCBI Homepage MyNCBI Homepage Main Content Main Navigation
. 2018 Nov 5;14(11):e1006512.
doi: 10.1371/journal.pcbi.1006512. eCollection 2018 Nov.

Chromatin remodelers couple inchworm motion with twist-defect formation to slide nucleosomal DNA

Affiliations

Chromatin remodelers couple inchworm motion with twist-defect formation to slide nucleosomal DNA

Giovanni B Brandani et al. PLoS Comput Biol. .

Abstract

ATP-dependent chromatin remodelers are molecular machines that control genome organization by repositioning, ejecting, or editing nucleosomes, activities that confer them essential regulatory roles on gene expression and DNA replication. Here, we investigate the molecular mechanism of active nucleosome sliding by means of molecular dynamics simulations of the Snf2 remodeler translocase in complex with a nucleosome. During its inchworm motion driven by ATP consumption, the translocase overwrites the original nucleosome energy landscape via steric and electrostatic interactions to induce sliding of nucleosomal DNA unidirectionally. The sliding is initiated at the remodeler binding location via the generation of a pair of twist defects, which then spontaneously propagate to complete sliding throughout the entire nucleosome. We also reveal how remodeler mutations and DNA sequence control active nucleosome repositioning, explaining several past experimental observations. These results offer a detailed mechanistic picture of remodeling important for the complete understanding of these key biological processes.


Conflict of interest statement

The authors have declared that no competing interests exist.

Figures
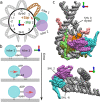
Fig 1
Fig 1. Structure of the translocase-nucleosome complex.
(a) Cartoon where nucleosome regions are indicated by the number of DNA turns from the dyad symmetry axis; superhelical location (SHL) 0 corresponds to the dyad, the ATPase domain (lobe 1 in cyan, lobe 2 in purple) binds DNA at SHL 2, the strong histone-DNA contact points are located at the half-integer SHLs where the DNA minor groove faces the octamer, e.g. -1.5 and -2.5. For clarity, we only depict the region from SHL -4 to +4. To analyze DNA sliding, we track the base pair indexes Δbpi at these contact points relative to the initial conformation. If, for example, nucleosome sliding starts with the motion of DNA at contact point 1.5 by 1 bp towards the dyad (red arrow), the contact index Δbp1.5 will increase from ~0 to ~1, and this will also indicate the formation of a +1bp defect at SHL 1 (in brown) and a -1bp twist defect at SHL 2 (in green), respectively accommodating an extra and a missing base pair relative to the reference nucleosome conformation in the crystal structure with PDB id 1KX5. (b) Inchworm mechanism of translocase motion along DNA. ATP binding induces a conformational change from open to closed, with the motion of lobe 1 towards lobe 2 by 1 bp, due to the weaker DNA contacts of the former. ATP hydrolysis weakens the lobe 2-DNA contacts and induces opening via the motion of lobe 2 away from lobe 1 by 1 bp. ADP release completes the cycle. (c) Two views of the initial Snf2-nucleosome structure for our coarse-grained MD simulations: DNA backbone (phosphate and sugar groups) in gray, bases in white, translocase lobes in cyan and purple, histones H3 in pink, H4 in orange, H2A and H2B in light and dark green respectively (in top snapshot only). From the bottom view it is possible to appreciate the contacts between the translocase lobe 1 and the opposite DNA gyre at SHL -6. All nucleosome orientations are indicated by the red, green and blue axes.
Fig 2
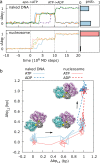
Fig 2. Snf2 translocase motion relative to DNA via an inchworm mechanism.
(a) Representative trajectories (indicated by different colors) of the average lobe contact index <ΔbpL> = (ΔbpL1+ΔbpL2)/2 during the ATP cycle in our MD simulations (ATP binding occurs after equilibration at time 0, hydrolysis occurs after 107 MD steps) on naked (upper left) and nucleosomal (lower left) DNAs with polyApG sequence. In both cases we find unidirectional motions; a 1 bp step of the translocase in direction from lobe 1 to lobe 2 occurs every ATP cycle with probabilities of ~0.45 and ~0.98 on naked DNA (upper right) and on nucleosomal DNA (lower right), respectively. Probabilities are calculated from the histograms of the integer values closest to <ΔbpL> at 2x10⁷ MD steps after ATP binding, out of 40 and 100 MD simulations on naked DNA and nucleosome respectively. (b) Projections of two representative trajectories (blue for naked, red for nucleosomal DNAs) on the lobe contact indexes ΔbpL1 and ΔbpL2 (lighter solid lines for the ATP state, darker dashed lines for the ADP state after hydrolysis), highlighting the inchworm mechanism. Snapshots of translocase moving on naked DNA are also shown (lobe 1 in cyan, lobe 2 in purple, DNA in gray, two reference phosphates in yellow).
Fig 3
Fig 3. Mechanism of directed nucleosomal DNA sliding by Snf2.
(a,c) For polyApG (a) and 601Δ3 (c) sequences, we show representative trajectories (indicated by different colors) of the average contact index at SHL 2, (Δbp1.5+Δbp2.5)/2, as a function of time (left panel) and the probabilities of (Δbp1.5+Δbp2.5)/2 at 107 MD steps after ATP binding computed from 100 trajectories (right), for the remodeler-bound case (upper), and in the absence of remodeler (spontanous sliding) (lower). For the remodeler case, we report only the portion of trajectory in the ATP state, where nucleosome sliding occurs after the translocase closure (indicated by the circles). (b,d) For polyApG (b) and 601Δ3 (d) sequences we report the free energy profiles along the average contact index at SHL 2 for different systems: spontaneous sliding in the absence of the remodeler (no Snf2), in the complexes with the bound open apo-state Snf2 (apo-Snf2WT), the closed ATP-bound Snf2 (ATP-Snf2WT), and the closed ATP-bound K855E-R880E-K885E charge mutant Snf2 (ATP-Snf2mut). Errors on the free-energy profiles are on the order of ~0.3 kBT. The cartoons in panel a indicate how the inchworm motion of the translocase (lobe 1 in cyan, lobe 2 in purple) is coupled to nucleosome sliding. The structure of the Snf2-nucleosome complex in the inset in panel b highlights the location of the K855, R880 and K885 residues (orange) targeted by the mutation. In panel c we also displayed the central 63 base pairs of the 601Δ3 sequence highlighting the location of the TpA positioning steps within the Snf2-nucleosome complex (in blue). In the initial configuration for the 601Δ3 simulations, the DNA is shifted by 3 bp relative to the optimal structure with PDB id 5X0Y (with the TpA steps located where the DNA minor groove faces the histone octamer, indicated with a blue dashed line).
Fig 4
Fig 4. Active nucleosome repositioning via twist defect propagation for polyApG sequence.
(a) Timelines of the translocase (L1 and L2) and nucleosome contact indexes (SHL -4.5 to 4.5) for two representative trajectories where nucleosomal DNA slides by 1 bp relative to the initial configuration. The intermediate configurations along the repositioning pathway are indicated by the corresponding labels (described in the main text) and cartoons. The key twist defects facilitating repositioning are highlighted by a plus sign for +1bp defects (in brown in the cartoons) and by a minus sign for -1bp defects (in green in the cartoons). DNA and translocase lobes (1 in cyan, 2 in purple) motions are indicated by red arrows. ATP binding occurs at time 0, whereas ATP hydrolysis occurs at 107 MD steps. (b) 2-dimensional projections of the trajectories in panel a (traj. 1 in green, traj. 2 in red; lighter solid lines for the ATP state, darker dashed lines after hydrolysis; time increases in the direction indicated by the arrows). The x-axis represents the sum of the translocase and nucleosome contact indexes around the remodeler binding location at SHL 2: ΔbpL1+ΔbpL2+Δbp1.5+Δbp2.5. The y-axis represents the size of the twist defects at the three central SHLs: Δbp1.5-Δbp-1.5. The key metastable states along the repositioning pathways, indicated by the same labels used in panel a, can be well distinguished as individual clusters on this low-dimensional projection. (c) Twist defect coordinates at SHL 1 (= Δbp1.5-Δbp0.5, brown, solid line) and SHL 2 (= Δbp2.5-Δbp1.5, purple, dashed) averaged over 100 MD trajectories as a function of time, showing how twist defects are formed after ATP binding and translocase closure (at 0 MD steps; panel c, left), and how they are released after hydrolysis and translocase opening (at 107 MD steps; panel c, right).
Fig 5
Fig 5. Twist-defect-mediated effects due to DNA sequence.
(a) Considered DNA sequences apart from the reference polyApG: polyApG-ApASHL1 (inner circle) and polyApG-TpASHL2 (outer). We displayed the central 71 base pairs highlighting their location relative to the translocase-nucleosome complex. (b) Comparison of the free energy profiles along the minimum energy pathways of repositioning from state cB1 to state cD1; polyApG (black, solid line), polyApG-ApASHL1 (red, dashed), and polyApG-TpASHL2 (green, dotted). Errors on the profiles are within ~0.3 kBT. (c) Free energy landscapes of the Snf2-nucleosome complex in the closed conformation along the average contact index at SHL 2, (Δbp1.5+Δbp2.5)/2, and the size of the twist defects around the dyad (Δbp1.5-Δbp-1.5), for the three DNA sequences polyApG (left), polyApG-ApASHL1 (center) and polyApG-TpASHL2 (right). The minimum energy pathways are indicated on the landscapes by black solid lines.

Similar articles

Cited by

References

    1. Richmond TJ, Davey CA. The structure of DNA in the nucleosome core. Nature. Nature Publishing Group; 2003;423: 145–150. 10.1038/nature01595 - DOI - PubMed
    1. Lai WKM, Pugh BF. Understanding nucleosome dynamics and their links to gene expression and DNA replication. Nat Rev Mol Cell Biol. Nature Publishing Group; 2017;18: 548–562. 10.1038/nrm.2017.47 - DOI - PMC - PubMed
    1. Field Y, Kaplan N, Fondufe-Mittendorf Y, Moore IK, Sharon E, Lubling Y, et al. Distinct Modes of Regulation by Chromatin Encoded through Nucleosome Positioning Signals. Ohler U, editor. PLoS Comput Biol. Public Library of Science; 2008;4: e1000216 10.1371/journal.pcbi.1000216 - DOI - PMC - PubMed
    1. Struhl K, Segal E. Determinants of nucleosome positioning. Nat Struct Mol Biol. 2013;20: 267–273. 10.1038/nsmb.2506 - DOI - PMC - PubMed
    1. Teif VB, Vainshtein Y, Caudron-Herger M, Mallm J-P, Marth C, Höfer T, et al. Genome-wide nucleosome positioning during embryonic stem cell development. Nat Struct Mol Biol. Nature Publishing Group; 2012;19: 1185–1192. 10.1038/nsmb.2419 - DOI - PubMed

Publication types

MeSH terms

Grants and funding

This work was supported by JSPS KAKENHI grants [25251019 to ST, 16KT0054 to ST, and 16H01303 to ST] (http://www.jsps.go.jp/english/), by the MEXT as “Priority Issue on Post-K computer” to ST (http://www.mext.go.jp/en/), and by the RIKEN Pioneering Project “Dynamical Structural Biology” to ST (http://www.riken.jp/en/). The funders had no role in study design, data collection and analysis, decision to publish, or preparation of the manuscript.