iBet uBet web content aggregator. Adding the entire web to your favor.


Link to original content: https://pubmed.ncbi.nlm.nih.gov/30146301
Sodium Channel SCN3A (NaV1.3) Regulation of Human Cerebral Cortical Folding and Oral Motor Development - PubMed Skip to main page content
U.S. flag

An official website of the United States government

Dot gov

The .gov means it’s official.
Federal government websites often end in .gov or .mil. Before sharing sensitive information, make sure you’re on a federal government site.

Https

The site is secure.
The https:// ensures that you are connecting to the official website and that any information you provide is encrypted and transmitted securely.

Access keys NCBI Homepage MyNCBI Homepage Main Content Main Navigation
. 2018 Sep 5;99(5):905-913.e7.
doi: 10.1016/j.neuron.2018.07.052. Epub 2018 Aug 23.

Sodium Channel SCN3A (NaV1.3) Regulation of Human Cerebral Cortical Folding and Oral Motor Development

Affiliations

Sodium Channel SCN3A (NaV1.3) Regulation of Human Cerebral Cortical Folding and Oral Motor Development

Richard S Smith et al. Neuron. .

Abstract

Channelopathies are disorders caused by abnormal ion channel function in differentiated excitable tissues. We discovered a unique neurodevelopmental channelopathy resulting from pathogenic variants in SCN3A, a gene encoding the voltage-gated sodium channel NaV1.3. Pathogenic NaV1.3 channels showed altered biophysical properties including increased persistent current. Remarkably, affected individuals showed disrupted folding (polymicrogyria) of the perisylvian cortex of the brain but did not typically exhibit epilepsy; they presented with prominent speech and oral motor dysfunction, implicating SCN3A in prenatal development of human cortical language areas. The development of this disorder parallels SCN3A expression, which we observed to be highest early in fetal cortical development in progenitor cells of the outer subventricular zone and cortical plate neurons and decreased postnatally, when SCN1A (NaV1.1) expression increased. Disrupted cerebral cortical folding and neuronal migration were recapitulated in ferrets expressing the mutant channel, underscoring the unexpected role of SCN3A in progenitor cells and migrating neurons.

Keywords: Cortical Development; Na(V)1.1; Na(V)1.3; Oromotor; Outer Radial Glia; Polymicrogyria; SCN1A; SCN3A; Speech; Voltage-Gated Sodium Channel (VGSC).


Conflict of interest statement

DECLARATION OF INTERESTS

The authors declare no competing interests.

Figures
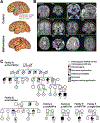
Figure 1.
Figure 1.. Pathogenic variants in SCN3A disrupt cerebral cortical formation and oral motor function
(A) MRI reconstruction of control (upper and middle panels) and age-matched affected individual B03 (lower panel). Red box outlines the PMG of perisylvian and surrounding areas. (B) Representative MRIs of affected individuals (Families A-F) reveal cortical malformations, PMG, abnormal gyral folding patterns, and shallow sulci. White dotted circles denote affected brain regions. MRI of asymptomatic individual A09 did not reveal visible PMG. Control, unaffected 11-year-old. Scale bar = 2cm. (C) Family A pedigree with a dominantly inherited point mutation causing amino acid change Phe1759Tyr in SCN3A. Family B pedigree with a dominantly inherited point mutation causing amino acid change Ile1344Leu in SCN3A. Single affected individual in Family C with a de novo point mutation causing amino acid change Leu850Pro in SCN3A. Single affected individuals in Families D and E with a de novo point mutation causing amino acid change Ile875Thr in SCN3A. Single affected individual in Family F with a point mutation causing amino acid change Arg621His in SCN3A; paternal sample unavailable (NA). Square, male; circle, female; black quadrant shading, affected individual (see phenotype legend). See also Figure S1 and Table S1.
Figure 2.
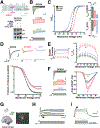
Figure 2.. Pathogenic SCN3A variants alter channel physiology
(A) Top, Schematic of SCN3A alpha subunit where colored circles indicate approximate locations of mutations identified in Families A-F. Bottom, WT and pathogenic sodium channels are similarly expressed in transfected HEK293T cells. (B) Representative voltage clamp recordings from SCN3A transfected HEK293T cells evoked by the voltage step activation protocol (5mV increments; -100 to +50 mV). Scale bar = 1nA/3ms. (C) Left: Average voltage activation curve fit with Boltzmann equation (see STAR Methods), plotted as normalized conductance against step voltage demonstrate F1759Y (red) and I875T (blue) variants produce depolarizing and hyperpolarizing shifts in voltage dependent activation, respectively. Right upper: Bar graph shows conductance of largest evoked SCN3A current (normalized to cell capacitance) as decreased in F1759Y (red) and I875T (blue) variants; lower: Bar graph shows a positive and negative shift in V½ voltage of activation for F1759Y and I875T variants compared to WT-SCN3A. (D) Upper: Representative sodium currents evoked by inactivation protocol. Lower: Voltage dependence of NaV current inactivation demonstrate F1759Y and I875T variants having shifted inactivation compared to WT-SCN3A. Boltzmann fit plotted as normalized current (channel availability) at 0 mV against the conditioning pre-pulse potential (-100 to 0 mV, See Table S2). (E) Left: Peak normalized sodium transient currents. Right: Voltage step plotted vs. persistent current (I-NaP), I-NaP measurement collected as the mean of the last 30 ms of the voltage step and presented as percent maximal peak inward current, demonstrate increase persistent current in F1759Y and I875T variants, compared to WT. (F) Left: Representative voltage clamp recordings, current density measurements indicated from area regions in yellow (15 ms). Right: Na+ currents plotted as current density against the stepping potential demonstrate F1759Y and I875T variants differentially affect current flow compared to WT. See also Table S2. (G) Primary culture of dissociated human fetal cortical neurons generated from 19 weeks gestation (WKSG) cortical plate. (H) Representative voltage clamp recordings from neurons in (G) evoked by the voltage step activation protocol (20mV increments; -80 to +40 mV) reveal sodium influx (black arrow). Scale bar = 100pA/1ms. (I) Representative current clamp recordings from same neurons (resting Vm = -57mV) evoked by current stepping protocol (10pA increments, 500ms) demonstrate fetal neurons lack action potentials, but have small voltage-activated depolarizing potentials that likely represent immature voltage gated Na+ influx (black arrow). Scale bar = 10mV/200ms. Measurements presented as mean ± S.E.M. (t-test; *P < 0.05, **P < 0.01).
Figure 3.
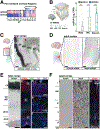
Figure 3.. SCN3A expression is developmentally regulated in human brain
(A) SCN3A transcripts are enriched during fetal gestational weeks (WKSG) and decrease postnatally. SCN1A (NaV1.1) expression starts lower and increases postnatally. Raw data analyzed from Allen Brain Atlas, presented as log2 RPKM (reads per kilobase per million) values. See also Figure S3C. (B) Single cell RNAseq dataset generated from 16–18 WKSG fetal cortex (Pollen et al., 2015), show higher SCN3A vs. SCN1A expression in radial glial cells (RGCs), intermediate progenitor cells (IPCs) and neurons (RGCs: p < 0.005; IPCs: p < 0.001; neurons: p < 0.001). Graph depicts two-part Wilcoxon test; **p < 0.01, ***p < 0.001 with Bonferroni adjusted alpha level of 0.017 (0.05/3). See also Figure S3A. (C) SCN3A mRNA in situ hybridization at 20 WKSG shows higher expression in the cortical plate (CP), and lower expression in the subventricular zone (SVZ). (D) SCN3A mRNA in situ hybridization in adult cortex. NeuN (RBFOX3) mRNA in situ hybridization reveals architecture and neurons in tissue section (38 y.o.; scale bar = 1cm). (E) Chromogenic mRNA in situ hybridization (i) and corresponding fluorescence imaging (ii) of 20 WKSG brain. Cell type specific markers for intermediate progenitors (TBR2) and neural progenitors (Vimentin, VIM) show SCN3A transcripts in SVZ/VZ. Scale bar left = 500μm; right = 25μm. See also Figure S3A. (F) mRNA in situ for SCN3A (i) and NeuN (ii) with fluorescence imaging (iii) of adult cortex (38 y.o., Brodmann area 27). Scale bar = 500μm. VZ, ventricular zone; IMZ, intermediate zone; SP, subplate; WM, white matter; Roman numerals (I - VI) correspond to approximate cortical layers. See also Figure S3.
Figure 4.
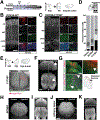
Figure 4.. Expression of mutant SCN3A disrupts neuronal migration and ferret cerebral cortical gyrification
(A) Schematic of human and ferret development and study design. (B, C) Cerebral cortex of kits (P0) following an IUE at E33 with mCherry together with SCN3A-WT or -F1759Y; Tiled confocal images; scale bar = 25μm. Colocalization of mCherry-positive cells in the VZ/SVZ with cell type specific markers: progenitor (Ki67, TBR2), glial-astrocyte (GFAP), and neuronal (TUJ1) show mCherry expression in neurons. (D) Distribution pattern across cortex (bins 1–5) of mCherry positive cells in (A) reveals SCN3A alters neuronal migration (t-test; *p < 0.05, **p < 0.01). See also Figure S4F. (E) Upper: schematics of study design and stereotyped ferret gyri/sulci at P33. Lower: P30 ferret brain expressing electroporated SCN3A-F1759Y resulting in atypical gyrification pattern. (F) MRI images of P33 brain expressing SCN3A-F1759Y; scale bar = 5mm. Right, arrow denotes clusters of gray matter heterotopia. (G) Upper: mCherry positive (red) and Nissl (green) positive cells in brain sections from (F); scale bar = 2mm. Inset, higher magnification image suggesting a non-cell autonomous effect of SCN3A activation (right panel scale bar = 200μm). Lower: mCherry positive cells analyzed as in (C). Examples of brains expressing WT SCN3A (H, I) and mCherry vector (J, K), show stereotyped brain development. Scale bar = 5mm. See also Figure S4.

Comment in

Similar articles

Cited by

References

    1. Ackman JB, Crair MC, (2014). Role of emergent neural activity in visual map development. Current Opinion in Neurobiology 24, 166–175. doi:10.1016/j.conb.2013.11.011 - DOI - PMC - PubMed
    1. Adam MP, Ardinger HH, Pagon RA, Wallace SE, Bean LJ, Mefford HC, Stephens K, Amemiya A, Ledbetter N, Morgan A, Fisher SE, Scheffer I, Hildebrand M, (1993). FOXP2-Related Speech and Language Disorders.
    1. Aman TK, Grieco-Calub TM, Chen C, Rusconi R, Slat EA, Isom LL, Raman IM, (2009). Regulation of Persistent Na Current by Interactions between Subunits of Voltage-Gated Na Channels. Journal of Neuroscience 29, 2027–2042. doi:10.1523/JNEUROSCI.4531-08.2009 - DOI - PMC - PubMed
    1. Beckh S, Noda M, Lübbert H, Numa S, (1989). Differential regulation of three sodium channel messenger RNAs in the rat central nervous system during development. EMBO J. 8, 3611–3616. - PMC - PubMed
    1. Ben-Shalom R, Keeshen CM, Berrios KN, An JY, Sanders SJ, Bender KJ, (2017). Opposing Effects on NaV1.2 Function Underlie Differences Between SCN2A Variants Observed in Individuals With Autism Spectrum Disorder or Infantile Seizures. Biol. Psychiatry 0. doi:10.1016/j.biopsych.2017.01.009 - DOI - PMC - PubMed

Publication types

MeSH terms

Substances

LinkOut - more resources