iBet uBet web content aggregator. Adding the entire web to your favor.


Link to original content: https://pubmed.ncbi.nlm.nih.gov/29719261
Negative Feedback Phosphorylation of Gγ Subunit Ste18 and the Ste5 Scaffold Synergistically Regulates MAPK Activation in Yeast - PubMed Skip to main page content
U.S. flag

An official website of the United States government

Dot gov

The .gov means it’s official.
Federal government websites often end in .gov or .mil. Before sharing sensitive information, make sure you’re on a federal government site.

Https

The site is secure.
The https:// ensures that you are connecting to the official website and that any information you provide is encrypted and transmitted securely.

Access keys NCBI Homepage MyNCBI Homepage Main Content Main Navigation
. 2018 May 1;23(5):1504-1515.
doi: 10.1016/j.celrep.2018.03.135.

Negative Feedback Phosphorylation of Gγ Subunit Ste18 and the Ste5 Scaffold Synergistically Regulates MAPK Activation in Yeast

Affiliations

Negative Feedback Phosphorylation of Gγ Subunit Ste18 and the Ste5 Scaffold Synergistically Regulates MAPK Activation in Yeast

Shilpa Choudhury et al. Cell Rep. .

Abstract

Heterotrimeric G proteins (Gαβγ) are essential transducers in G protein signaling systems in all eukaryotes. In yeast, G protein signaling differentially activates mitogen-activated protein kinases (MAPKs)-Fus3 and Kss1-a phenomenon controlled by plasma membrane (PM) association of the scaffold protein Ste5. Here, we show that phosphorylation of the yeast Gγ subunit (Ste18), together with Fus3 docking on Ste5, controls the rate and stability of Ste5/PM association. Disruption of either element alone by point mutation has mild but reciprocal effects on MAPK activation. Disabling both elements results in ultra-fast and stable bulk Ste5/PM localization and Fus3 activation that is 6 times faster and 4 times more amplified compared to wild-type cells. These results further resolve the mechanism by which MAPK negative feedback phosphorylation controls pathway activation and provides compelling evidence that Gγ subunits can serve as intrinsic regulators of G protein signaling.

Keywords: G protein; G protein γ; MAPK; Ste18; Ste5; feedback; phosphorylation; scaffold; signaling; subunit; synergistic.


Conflict of interest statement

DECLARATION OF INTERESTS

The authors declare no competing interests.

Figures

Figure 1
Figure 1. Working Model of the Mating Pathway of Saccharomyces cerevisae
To facilitate clarity, a contemporary model of the pheromone pathway is shown here, which is inferred from prior studies described in the text. The mating pathway of Saccharomyces cerevisae is triggered in response to pheromone-dependent activation of the G-protein-coupled receptor, Ste2, and subsequent recruitment of Ste5 to the plasma membrane (PM), mediated by Ste5PM and Ste5PH domains as well as the Ste5RING domain that binds directly to free Gβ/Ste4. Under resting conditions, Ste5/PM association and MAPK activation is disfavored due to hyper-phosphorylation at positions surrounding Ste5PM (sites marked as sticks), auto-inhibition of the Ste5PH domain through a competitive interaction with Ste5VWA, and the lack of free Gβ/Ste4 that is sequestered by GDP-bound Gα/Gpa1. Pathway activation is also inhibited by the Ste5FBD, which allosterically activates Fus3 to promote phosphorylation of Ste5T287 and three other phosphosites proximal to Ste5FBD and Ste5RING (P-lollipops). Upon pheromone stimulation, cascade activation of MAP kinases relies on PM recruitment and stable association of Ste5 that is concomitant with several state changes, including (but not limited to): (1) upregulated expression of the phosphatase Ptc1, which competes with Fus3 for binding to Ste5FBD and promotes Ste5 de-phosphorylation; (2) a large conformational change in Ste5 accompanied by de-inhibition of Ste5VWA; and (3) MAPK cascade activation of Fus3 and Kss1. For simplicity, interactions involving proteins such as Ste20, Far1, Cdc42, Cdc24, and many more involved in shmoo formation are not shown. Central components of the model discussed extensively here as a framework for this work include the Ste5FBD and phosphoregulatory control by Fus3 and Ptc1, captured in part by Bhattacharyya et al. (2006), Coyle et al. (2013), and Malleshaiah et al. (2010); conformational dynamics and PM association of Ste5, captured in part by Takahashi and Pryciak (2008) and Zalatan et al. (2012); and the role of Gβγ/Ste5RING as an essential feature for Ste5/PM association, captured in part by Winters et al. (2005). Additional, but not all, contributions have been cited in the Introduction, Discussion, and Supplemental Information.
Figure 2
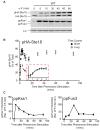
Figure 2. Ste18Nt Is Rapidly Phosphorylated in Response to GPCR Activation
(A) Immunoblots of HA-Ste18, activated MAPKs (ppKss1 and ppFus3), and a protein loading control (LC) in wild-type cells treated with 3 μM pheromone (α-F) for the indicated time (long time course). (B) Quantification of pHA-Ste18 over short (black circles) and long (gray circles) time course periods in wild-type cells. Data correspond to the percent abundance of phosphorylated HA-Ste18-Nt (pHA-Ste18) relative to total HA-Ste18 (mean ± SD; n = 12). Short and long time course data were normalized to each other at 5 min. (C) MAPK activation profile in wild-type cells from the long time course experiment shown in (A). See also Figures S1 and S2.
Figure 3
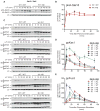
Figure 3. Phosphorylation on Ste18 and Ste5 Cooperate to Prevent Early and Maximal Fus3 Activation
Cells harboring the indicated combination of wild-type or mutant versions of Ste18 and Ste5 were stimulated with 3 μM α-F followed by quantitative immunoblot analysis of HA-Ste18 or activated Fus3 and Kss1. (A) HA-Ste18 immunoblot in cells harboring wild-type (WT/WT) or Ste5ND (WT/non-docking [ND]). (B) Quantitative comparison of pHA-Ste18 from (A) (n = 4). (C) Representative immunoblot for activated Kss1 and Fus3. (D) Quantitative comparison of activated Kss1 relative to wild-type peak activation at 5 min from immunoblots shown in (C). (E) Quantitative comparison of activated Fus3 relative to wild-type peak activation at 30 min from immunoblots shown in (C). Data represent mean ± SD; n = 12. SE, short exposure; LE, long exposure; LC, loading control. See also Figures S3, S4, and S5 and Table S2.
Figure 4
Figure 4. Phosphorylation on Ste18/Ste5 Regulates the Rate and Duration of Ste5 Association at the Plasma Membrane
Cells expressing phosphorylation mutants of Ste18 with either Ste5-GFP or Ste5ND-GFP were treated with α-factor to examine Ste5 localization by fluorescence microscopy (see Experimental Procedures). (A) Representative fluorescent images showing cells with localized GFP signal at the membrane before (top) or 23–26 min post-pheromone treatment (bottom). (B) Quantification of total Ste5-GFP fluorescence at the shmoo tip in cells treated with pheromone. (C) Time-resolved percentage of the cell population with Ste5-GFP localized at the plasma membrane in response to pheromone stimulation. Inset is indicated with a dashed line. (D) Zoomed view of the first 60 min from (C, inset). Time required before 100% of all cells display Ste5-GFP at the shmoo tip is indicated. (E) Mean duration of Ste5-GFP/PM association (at the site of an emerging or extant mating projection). (F) Immunoblot showing coIP of HA-Ste18 with Ste5-GFP from pheromone-treated cells. The lysate shown is 4% of the total lysate used for coIP (Experimental Procedures). (G) Quantitative analysis of immunoblots from coIP in (F). Bars represent fold enrichment of total HA-Ste18 relative to wild-type. Data represent mean ± SD; n = 3. All microscopy data represent GFP signal scored in 8–14 cells, with error bars depicting SEM in (B). See also Figure S6.
Figure 5
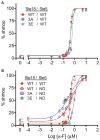
Figure 5. The Switch-like Morphological Response to Pheromone Is Regulated by Ste18-Nt Phosphorylation When Fus3 Cannot Bind to Ste5
The morphological dose-response to mating pheromone represented by the cellular formation of a mating projection (i.e., shmoo) was quantified as a percentage of total cells in a population by DIC microscopy. Data were fit to a sigmodal dose-response curve with variable slope. (A) Effect of individual Ste18Nt phosphorylation mutations on the mating response. (B) Effect of Ste18Nt phosphorylation mutations in strains exclusively expressing the Fus3 non-docking mutant Ste5ND. Error bars represent SEM across ≥200 cells per experiment. See also Table S3.
Figure 6
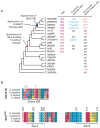
Figure 6. Coordinated Phospho-regulation of Ste18 and Ste5 Evolved at the Same Time
(A) Bootstrapped phylogenetic tree of Ste18 orthologs from the Ascomycota phylum showing the evolutionary co-occurrence of regulatory phosphorylation sites on the N-terminal tail of the Gγ subunit and the FBD of orthologous Ste5 scaffolds. The presence of Ste5 orthologous proteins, functional Ste5-like FBDs, and N-terminal Gγ phospho-regulatory intrinsically disordered regions (IDRs) are shown next to yeast species harboring each element. (B) Species that contain the synergistic regulatory element (Ste18Nt and Ste5FBD) are nearly 100% identical at phosphorylation site alignment positions in Ste18 and MAPK binding sites reported previously in Ste5 (Coyle et al., 2013). See also Figure S7.
Figure 7
Figure 7. Phosphorylated Ste18Nt and Ste5FBD Constitute a Dynamic Phosphoregulatory System for Pheromone Signaling
(A) In response to pheromone, Ste18 is rapidly phosphorylated at its N-terminal tail (P-lollipop). Ste5 is simultaneously phosphorylated via negative feedback controlled by Fus3/Ste5FBD docking (P-lollipops). Together, this constitutes a phospho-inhibitory system that prevents otherwise rapid Ste5/PM association. While not shown outright here, previous work implicates pheromone-stimulated expression of Ptc1 phosphatase and removal of inhibitory phosphorylation on Ste5 as the inhibition release (Malleshaiah et al., 2010) (dashed orange box). Consequently, the mating pathway is activated with a kinetic delay, as evident by the slower rate of Ste5 association at the membrane and delayed peak activation of Fus3. (B) Cells engineered to prevent activation of the Ste18/Ste5 system (Ste183A/Ste5ND) respond ~6 times faster with ~4 times greater intensity than observed in wild-type cells—a response that demonstrates synergy between the two phospho-regulatory elements (phosphorylated Ste18 and Ste5) in the system.

Similar articles

Cited by

References

    1. Arkowitz RA. Chemical gradients and chemotropism in yeast. Cold Spring Harb Perspect Biol. 2009;1:a001958. - PMC - PubMed
    1. Bargmann CI. Comparative chemosensation from receptors to ecology. Nature. 2006;444:295–301. - PubMed
    1. Bhattacharyya RP, Reményi A, Good MC, Bashor CJ, Falick AM, Lim WA. The Ste5 scaffold allosterically modulates signaling output of the yeast mating pathway. Science. 2006;311:822–826. - PubMed
    1. Cabrera-Vera TM, Vanhauwe J, Thomas TO, Medkova M, Preininger A, Mazzoni MR, Hamm HE. Insights into G protein structure, function, and regulation. Endocr Rev. 2003;24:765–781. - PubMed
    1. Cappell SD, Baker R, Skowyra D, Dohlman HG. Systematic analysis of essential genes reveals important regulators of G protein signaling. Mol Cell. 2010;38:746–757. - PMC - PubMed

Publication types

MeSH terms

Substances

LinkOut - more resources