A Mixed Periodic Paralysis & Myotonia Mutant, P1158S, Imparts pH-Sensitivity in Skeletal Muscle Voltage-gated Sodium Channels
- PMID: 29674667
- PMCID: PMC5908869
- DOI: 10.1038/s41598-018-24719-y
A Mixed Periodic Paralysis & Myotonia Mutant, P1158S, Imparts pH-Sensitivity in Skeletal Muscle Voltage-gated Sodium Channels
Abstract
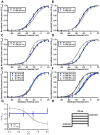
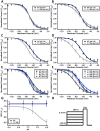
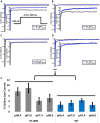
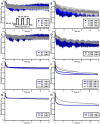
Skeletal muscle channelopathies, many of which are inherited as autosomal dominant mutations, include myotonia and periodic paralysis. Myotonia is defined by a delayed relaxation after muscular contraction, whereas periodic paralysis is defined by episodic attacks of weakness. One sub-type of periodic paralysis, known as hypokalemic periodic paralysis (hypoPP), is associated with low potassium levels. Interestingly, the P1158S missense mutant, located in the third domain S4-S5 linker of the "skeletal muscle", Nav1.4, has been implicated in causing both myotonia and hypoPP. A common trigger for these conditions is physical activity. We previously reported that Nav1.4 is relatively insensitive to changes in extracellular pH compared to Nav1.2 and Nav1.5. Given that intense exercise is often accompanied by blood acidosis, we decided to test whether changes in pH would push gating in P1158S towards either phenotype. Our results suggest that, unlike in WT-Nav1.4, low pH depolarizes the voltage-dependence of activation and steady-state fast inactivation, decreases current density, and increases late currents in P1185S. Thus, P1185S turns the normally pH-insensitive Nav1.4 into a proton-sensitive channel. Using action potential modeling we predict a pH-to-phenotype correlation in patients with P1158S. We conclude that activities which alter blood pH may trigger the noted phenotypes in P1158S patients.
Conflict of interest statement
The authors declare no competing interests.
Figures



Similar articles
-
Cold-induced defects of sodium channel gating in atypical periodic paralysis plus myotonia.Neurology. 2008 Mar 4;70(10):755-61. doi: 10.1212/01.wnl.0000265397.70057.d8. Epub 2007 Sep 26. Neurology. 2008. PMID: 17898326 Free PMC article.
-
Cold induces shifts of voltage dependence in mutant SCN4A, causing hypokalemic periodic paralysis.Neurology. 2003 Oct 14;61(7):914-8. doi: 10.1212/01.wnl.0000086820.54065.a0. Neurology. 2003. PMID: 14557559
-
Voltage-sensor sodium channel mutations cause hypokalemic periodic paralysis type 2 by enhanced inactivation and reduced current.Proc Natl Acad Sci U S A. 2000 Aug 15;97(17):9549-54. doi: 10.1073/pnas.97.17.9549. Proc Natl Acad Sci U S A. 2000. PMID: 10944223 Free PMC article.
-
Sodium Channelopathies of Skeletal Muscle.Handb Exp Pharmacol. 2018;246:309-330. doi: 10.1007/164_2017_52. Handb Exp Pharmacol. 2018. PMID: 28939973 Free PMC article. Review.
-
Voltage-sensor mutations in channelopathies of skeletal muscle.J Physiol. 2010 Jun 1;588(Pt 11):1887-95. doi: 10.1113/jphysiol.2010.186874. Epub 2010 Feb 15. J Physiol. 2010. PMID: 20156847 Free PMC article. Review.
Cited by
-
Structural basis for the rescue of hyperexcitable cells by the amyotrophic lateral sclerosis drug Riluzole.Nat Commun. 2024 Sep 28;15(1):8426. doi: 10.1038/s41467-024-52539-4. Nat Commun. 2024. PMID: 39341837 Free PMC article.
-
The L1624Q Variant in SCN1A Causes Familial Epilepsy Through a Mixed Gain and Loss of Channel Function.Front Pharmacol. 2021 Dec 2;12:788192. doi: 10.3389/fphar.2021.788192. eCollection 2021. Front Pharmacol. 2021. PMID: 34925043 Free PMC article.
-
Cannabidiol Selectively Binds to the Voltage-Gated Sodium Channel Nav1.4 in Its Slow-Inactivated State and Inhibits Sodium Current.Biomedicines. 2021 Sep 2;9(9):1141. doi: 10.3390/biomedicines9091141. Biomedicines. 2021. PMID: 34572327 Free PMC article.
-
Cannabidiol and Sodium Channel Pharmacology: General Overview, Mechanism, and Clinical Implications.Neuroscientist. 2022 Aug;28(4):318-334. doi: 10.1177/10738584211017009. Epub 2021 May 24. Neuroscientist. 2022. PMID: 34027742 Free PMC article. Review.
-
Cannabidiol inhibits the skeletal muscle Nav1.4 by blocking its pore and by altering membrane elasticity.J Gen Physiol. 2021 May 3;153(5):e202012701. doi: 10.1085/jgp.202012701. J Gen Physiol. 2021. PMID: 33836525 Free PMC article.
References
Publication types
MeSH terms
Substances
LinkOut - more resources
Full Text Sources
Other Literature Sources


