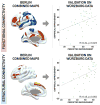
Connectivity Predicts deep brain stimulation outcome in Parkinson disease
- PMID: 28586141
- PMCID: PMC5880678
- DOI: 10.1002/ana.24974
Connectivity Predicts deep brain stimulation outcome in Parkinson disease
Abstract
Objective: The benefit of deep brain stimulation (DBS) for Parkinson disease (PD) may depend on connectivity between the stimulation site and other brain regions, but which regions and whether connectivity can predict outcome in patients remain unknown. Here, we identify the structural and functional connectivity profile of effective DBS to the subthalamic nucleus (STN) and test its ability to predict outcome in an independent cohort.
Methods: A training dataset of 51 PD patients with STN DBS was combined with publicly available human connectome data (diffusion tractography and resting state functional connectivity) to identify connections reliably associated with clinical improvement (motor score of the Unified Parkinson Disease Rating Scale [UPDRS]). This connectivity profile was then used to predict outcome in an independent cohort of 44 patients from a different center.
Results: In the training dataset, connectivity between the DBS electrode and a distributed network of brain regions correlated with clinical response including structural connectivity to supplementary motor area and functional anticorrelation to primary motor cortex (p < 0.001). This same connectivity profile predicted response in an independent patient cohort (p < 0.01). Structural and functional connectivity were independent predictors of clinical improvement (p < 0.001) and estimated response in individual patients with an average error of 15% UPDRS improvement. Results were similar using connectome data from normal subjects or a connectome age, sex, and disease matched to our DBS patients.
Interpretation: Effective STN DBS for PD is associated with a specific connectivity profile that can predict clinical outcome across independent cohorts. This prediction does not require specialized imaging in PD patients themselves. Ann Neurol 2017;82:67-78.
© 2017 American Neurological Association.
Conflict of interest statement
M.R., A.K., R.N., J. Vol., and A.A.K. have business relationships with Medtronics, St Judes, and Boston Scientific, which are makers of DBS devices, but none is related to the current work. M.D.F. has submitted a patent on using connectivity imaging to identify the ideal site for brain stimulation; the processing stream is different from this work.
Figures


Comment in
-
Parkinson disease: Deep brain stimulation - making the right connections.Nat Rev Neurol. 2017 Aug;13(8):450-451. doi: 10.1038/nrneurol.2017.91. Epub 2017 Jun 23. Nat Rev Neurol. 2017. PMID: 28643808 No abstract available.
Similar articles
-
Deep brain stimulation induced normalization of the human functional connectome in Parkinson's disease.Brain. 2019 Oct 1;142(10):3129-3143. doi: 10.1093/brain/awz239. Brain. 2019. PMID: 31412106
-
Left Prefrontal Connectivity Links Subthalamic Stimulation with Depressive Symptoms.Ann Neurol. 2020 Jun;87(6):962-975. doi: 10.1002/ana.25734. Epub 2020 Apr 30. Ann Neurol. 2020. PMID: 32239535
-
Meta-analysis comparing deep brain stimulation of the globus pallidus and subthalamic nucleus to treat advanced Parkinson disease.J Neurosurg. 2014 Sep;121(3):709-18. doi: 10.3171/2014.4.JNS131711. Epub 2014 Jun 6. J Neurosurg. 2014. PMID: 24905564
-
Improving outcomes of subthalamic nucleus deep brain stimulation in Parkinson's disease.Expert Rev Neurother. 2015 Oct;15(10):1151-60. doi: 10.1586/14737175.2015.1081815. Epub 2015 Sep 17. Expert Rev Neurother. 2015. PMID: 26377740 Review.
-
A Comprehensive Review of Brain Connectomics and Imaging to Improve Deep Brain Stimulation Outcomes.Mov Disord. 2020 May;35(5):741-751. doi: 10.1002/mds.28045. Epub 2020 Apr 12. Mov Disord. 2020. PMID: 32281147 Free PMC article. Review.
Cited by
-
Functional brain controllability in Parkinson's disease and its association with motor outcomes after deep brain stimulation.Front Neurosci. 2024 Nov 7;18:1433577. doi: 10.3389/fnins.2024.1433577. eCollection 2024. Front Neurosci. 2024. PMID: 39575098 Free PMC article.
-
Computational Neurosurgery in Deep Brain Stimulation.Adv Exp Med Biol. 2024;1462:435-451. doi: 10.1007/978-3-031-64892-2_26. Adv Exp Med Biol. 2024. PMID: 39523281 Review.
-
The effect of pallidal stimulation on sleep outcomes and related brain connectometries in Parkinson's disease.NPJ Parkinsons Dis. 2024 Nov 4;10(1):212. doi: 10.1038/s41531-024-00800-4. NPJ Parkinsons Dis. 2024. PMID: 39496609 Free PMC article.
-
Deep brain stimulation for Parkinson's disease: bibliometric analysis of the top 100 cited literature.Front Aging Neurosci. 2024 Oct 16;16:1413074. doi: 10.3389/fnagi.2024.1413074. eCollection 2024. Front Aging Neurosci. 2024. PMID: 39478694 Free PMC article. Review.
-
The Bioimaging Story of AIEgens.Chem Biomed Imaging. 2023 Jul 3;1(6):509-521. doi: 10.1021/cbmi.3c00056. eCollection 2023 Sep 25. Chem Biomed Imaging. 2023. PMID: 39473571 Free PMC article. Review.
References
-
- Schuepbach WMM, Rau J, Knudsen K, et al. Neurostimulation for Parkinson’s disease with early motor complications. N Engl J Med. 2013;368:610–622. - PubMed
-
- Lozano AM, Lipsman N. Probing and regulating dysfunctional circuits using deep brain stimulation. Neuron. 2013;77:406–424. - PubMed
-
- Litvak V, Jha A, Eusebio A, et al. Resting oscillatory corticosubthalamic connectivity in patients with Parkinson’s disease. Brain. 2011;134(pt 2):359–374. - PubMed
MeSH terms
Grants and funding
LinkOut - more resources
Full Text Sources
Other Literature Sources
Medical


