iBet uBet web content aggregator. Adding the entire web to your favor.


Link to original content: https://pubmed.ncbi.nlm.nih.gov/28092670
Neuropilin-1 is upregulated in the adaptive response of prostate tumors to androgen-targeted therapies and is prognostic of metastatic progression and patient mortality - PubMed Skip to main page content
U.S. flag

An official website of the United States government

Dot gov

The .gov means it’s official.
Federal government websites often end in .gov or .mil. Before sharing sensitive information, make sure you’re on a federal government site.

Https

The site is secure.
The https:// ensures that you are connecting to the official website and that any information you provide is encrypted and transmitted securely.

Access keys NCBI Homepage MyNCBI Homepage Main Content Main Navigation
. 2017 Jun 15;36(24):3417-3427.
doi: 10.1038/onc.2016.482. Epub 2017 Jan 16.

Neuropilin-1 is upregulated in the adaptive response of prostate tumors to androgen-targeted therapies and is prognostic of metastatic progression and patient mortality

Affiliations

Neuropilin-1 is upregulated in the adaptive response of prostate tumors to androgen-targeted therapies and is prognostic of metastatic progression and patient mortality

B W C Tse et al. Oncogene. .

Abstract

Recent evidence has implicated the transmembrane co-receptor neuropilin-1 (NRP1) in cancer progression. Primarily known as a regulator of neuronal guidance and angiogenesis, NRP1 is also expressed in multiple human malignancies, where it promotes tumor angiogenesis. However, non-angiogenic roles of NRP1 in tumor progression remain poorly characterized. In this study, we define NRP1 as an androgen-repressed gene whose expression is elevated during the adaptation of prostate tumors to androgen-targeted therapies (ATTs), and subsequent progression to metastatic castration-resistant prostate cancer (mCRPC). Using short hairpin RNA (shRNA)-mediated suppression of NRP1, we demonstrate that NRP1 regulates the mesenchymal phenotype of mCRPC cell models and the invasive and metastatic dissemination of tumor cells in vivo. In patients, immunohistochemical staining of tissue microarrays and mRNA expression analyses revealed a positive association between NRP1 expression and increasing Gleason grade, pathological T score, positive lymph node status and primary therapy failure. Furthermore, multivariate analysis of several large clinical prostate cancer (PCa) cohorts identified NRP1 expression at radical prostatectomy as an independent prognostic biomarker of biochemical recurrence after radiation therapy, metastasis and cancer-specific mortality. This study identifies NRP1 for the first time as a novel androgen-suppressed gene upregulated during the adaptive response of prostate tumors to ATTs and a prognostic biomarker of clinical metastasis and lethal PCa.


Conflict of interest statement

The authors declare no conflict of interest.

Figures

Figure 1
Figure 1
Transcriptional signature of the adaptive tumor response to ATTs. (a) Genes differentially expressed following castration of host mice versus non-castrated (‘intact’) LNCaP tumor xenografts at PSA nadir and CR. NRP1 is indicated by the large blue dot in the upper right quadrant. (b) Numbers of genes common to three data sets: LNCaP Enz-upregulated genes (top left), genes upregulated in LNCaP xenografts post-castration (top right) and genes upregulated in mCRPC versus localized PCa (Grasso et al., bottom; GSE35988). (c) Heatmap showing differential expression of the 120 gene subset identified in b in metastatic versus localized PCa data sets., , , , (d) NRP1 mRNA levels in clinical samples of metastasis versus primary localized PCa across multiple data sets., , , , *P<0.05, ***P<0.001. In c and d, log2 median centered gene expression data was downloaded from the Oncomine database.
Figure 2
Figure 2
Regulation of NRP1 expression by the androgen signaling axis. (a) Relative NRP1 mRNA expression in LNCaP cells grown in CSS after 48-h treatment with 10 nM DHT, 1 nM R1881 or vehicle. (b) Modified UCSC screenshot showing AR binding sites (ChIP-seq) proximal to the NRP1 gene in 13 PCa samples (GSE70079). Each track depicts ChIP-seq AR binding intensity for a given sample. (c) ChIP-quantitative PCR (qPCR) demonstrates AR binding to distal 1 and Intron_12 regions at the NRP1 gene locus. The dotted line demarcates no enrichment over an IgG control ChIP. A known AR binding site in the KLK3 enhancer region was used as a positive control, whereas a gene-poor region on chromosome 20 with no previous evidence of AR binding was used as a negative control (NC). (d) NRP1 expression in LNCaP cells grown in CSS after 48- h treatment with 10 nM DHT and AR or scrambled control (scr) small interfering RNA. For AR and KLK3/PSA mRNA levels refer to Supplementary Figure 1. (e) NRP1 expression in LNCaP cells grown in CSS after 48- h treatment with 10 nM DHT with or without Bic or ENZ co-treatment. (f) qPCR analysis of NRP1 and PSA expression and (g) western blot analysis of NRP1 expression in LNCaP cells after culture in CSS for 1, 3, 5 or 7 days, or 7 days followed by 3 days of DHT treatment (10 nM). (h) NRP1 mRNA expression levels in LuCaP35 xenografts following sham castration (sham) or castration (Cx) of host mice. Raw expression data from GSE33316. *P<0.05; **P<0.01; ****P<0.0001.
Figure 3
Figure 3
NRP1 expression is dynamically regulated during the adaptive response to ATTs and progression to mCRPC. (a) Microarray analysis of NRP1 expression in LNCaP xenografts harvested from non-castrated mice (intact) and during progression to CR after castration of host nude mice. (b) Western blot of NRP1 in parental LNCaP cells and their androgen-independent variant, LNCaP-AI. (c) NRP1 mRNA expression in hormone naive primary PCa biopsies compared with hormone refractory samples from data set GDS1390. (d) NRP1 mRNA levels in benign, localized PCa and mCRPC samples from Grasso et al. Data extracted from GSE35988. (e) Scatterplot showing log2 RPKM normalized NRP1 RNA-seq read counts from individual mCRPC samples (n=118) from the Stand Up To Cancer (SU2C)/Prostate Cancer Foundation (PCF) Dream Team cohort. Data obtained from cBioPortal., (d, e) Error bars represent s.e.m. ****P <0.0001.
Figure 4
Figure 4
NRP1 promotes the invasion and metastatic dissemination of mCRPC cell models. (a) Flow cytometric quantification of NRP1 protein levels in benign (BPH-1, RWPE-1) and tumorigenic PCa cell lines. Error bars: s.d. n=3, *P <0.05. (b) Western blot of NRP1 expression in PC3-shCntrl, -shNRP1(1) and -shNRP1(2) total cell lysates. (c) Left panel: relative confluence of PC3-shCntrl (black lines), -shNRP1(1) (red lines) and -shNRP1(2) (blue lines) cells over 48 h measured by the CellPlayer Kinetic Proliferation assay. Right panel: DNA content in the same cell lines quantified by PicoGreen assay after 1, 3 and 5 days. (d) Representative phase-contrast images of PC3-shRNA models grown in 2D monolayer and (e) 3D On-top Matrigel cultures. Scale bars, 100 μm. (f) Quantification of vimentin and E-cadherin protein expression using the In-Cell Western technique (LI-COR) on intact PC3-shCntrl, -shNRP1(3) and -shNRP1(5) cells. Wells were stained immediately following wound scratch assays reported in Supplementary Figure 2. Bar chart displays combined intensity data (n=16 wells from three experiments). Error bars: s.d. (g) Vimentin and E-cadherin protein expression detected by immunofluorescence in PC3-shCntrl and -shNRP1(3) cells after 10 days of 3D On-top Matrigel culture. Red: actin; blue: DAPI. × 60 magnification. (h) Zebrafish-xenografted control (shCntrol) and NRP1 knockdown (shNRP1 (1) and shNRP1 (2)) PC3 cells (red fluorescent signal) at 1 day (left panels) and 5 days (right panels) post-injection (dpi). White arrows indicate metastatic dissemination outside of the yolk sac. (i) Percentage incidence of metastasis in xenografted zebrafish (n= 64, shContrl; n=30, shNRP1 (1); n=28, shNRP1 (2)). P=0.0002 (chi-square test).
Figure 5
Figure 5
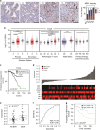
Increased NRP1 expression is associated with tumor progression and primary therapy failure. (a) Representative images of BPH and Gleason grade 3, 4 or 5 (G3, G4, G5) tumor samples from a tissue microarray stained for NRP1. Scale bars, 100 μm. Right panel: summary of NRP1 staining intensity scores across Gleason grades. Scoring scale: no staining (0), low (+1), moderate to high (+2). (b) RNA-sequencing data from the TCGA PRAD cohort comparing NRP1 mRNA expression in patients with tumors of varying Gleason pattern (primary and secondary, leftmost 2 panels), pathological T scores (middle panel) and node status/response to primary therapy (rightmost 2 panels). *P<0.05; **P<0.01; ***P<0.001; ****P<0.0001. PR, partial response; SD, stable disease. (c) Kaplan–Meier curves showing relapse-free survival in 498 PCa patients stratified according to the median levels (high versus low) for NRP1 expression (RNA-seq, log2(x+1) RSEM) in the TCGA PRAD cohort. (d) NRP1 expression in TJU post-radiotherapy samples. Each sample is annotated in the colored matrix below the plot. ECE, extra-capsular extension; LNI, lymph node invasion; MET, metastasis; SM, surgical margin; SVI, seminal vesicle invasion. (e) Boxplot showing NRP1 expression in patients positive and negative for BCR. (f) ROC curve for NRP1 expression predicting BCR. (g) Kaplan–Meier curve showing BCR-free survival for NRP1 high and low expression groups.
Figure 6
Figure 6
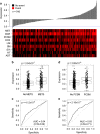
NRP1 expression predicts metastasis and PCSM following RP. (a) NRP1 expression in Mayo Clinic patient samples. Each sample is annotated in the colored matrix below the plot. ADT, androgen deprivation therapy; ECE, extra-capsular extension; LNI, lymph node invasion; MET, metastasis; RT, radiation therapy; SM, surgical margin; SVI, seminal vesicle invasion. (b) NRP1 expression in patients positive and negative for METS. (c) ROC curve for NRP1 expression predicting metastasis. (d) NRP1 expression in patients positive and negative for PCSM. (e) ROC curve for NRP1 expression predicting PCSM.
Figure 7
Figure 7
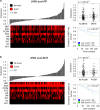
High NRP1 expression in RP samples is prognostic of metastatic progression and cancer-specific mortality in a natural history cohort. Waterfall plots showing NRP1 expression in JHMI patient cohorts in (a) post-RP and (b) post-BCR samples. Each sample is annotated in the colored matrix below the plot. ECE, extra-capsular extension; LNI, lymph node invasion; MET, metastasis; SM, surgical margin; SVI, seminal vesicle invasion. Boxplots showing NRP1 expression in patients positive and negative for METS (a) and PCSM (b). Kaplan–Meier curves showing MET-free (a) and PCSM-free (b) survival for NRP1 high and low expression groups.

Similar articles

Cited by

References

    1. Heidenreich A, Bastian PJ, Bellmunt J, Bolla M, Joniau S, van der Kwast T et al. EAU guidelines on prostate cancer. Part II: treatment of advanced, relapsing, and castration-resistant prostate cancer. Eur Urol 2014; 65: 467–479. - PubMed
    1. de Bono JS, Oudard S, Ozguroglu M, Hansen S, Machiels JP, Kocak I et al. Prednisone plus cabazitaxel or mitoxantrone for metastatic castration-resistant prostate cancer progressing after docetaxel treatment: a randomised open-label trial. Lancet 2010; 376: 1147–1154. - PubMed
    1. Tannock IF, de Wit R, Berry WR, Horti J, Pluzanska A, Chi KN et al. Docetaxel plus prednisone or mitoxantrone plus prednisone for advanced prostate cancer. N Engl J Med 2004; 351: 1502–1512. - PubMed
    1. Sweeney CJ, Chen YH, Carducci M, Liu G, Jarrard DF, Eisenberger M et al. Chemohormonal therapy in metastatic hormone-sensitive prostate cancer. N Engl J Med 2015; 373: 737–746. - PMC - PubMed
    1. James ND, Sydes MR, Clarke NW, Mason MD, Dearnaley DP, Spears MR et al. Addition of docetaxel, zoledronic acid, or both to first-line long-term hormone therapy in prostate cancer (STAMPEDE): survival results from an adaptive, multiarm, multistage, platform randomised controlled trial. Lancet 2016; 387: 1163–1177. - PMC - PubMed

Publication types