iBet uBet web content aggregator. Adding the entire web to your favor.


Link to original content: https://pubmed.ncbi.nlm.nih.gov/27679481/
A de novo compound targeting α-synuclein improves deficits in models of Parkinson's disease - PubMed Skip to main page content
U.S. flag

An official website of the United States government

Dot gov

The .gov means it’s official.
Federal government websites often end in .gov or .mil. Before sharing sensitive information, make sure you’re on a federal government site.

Https

The site is secure.
The https:// ensures that you are connecting to the official website and that any information you provide is encrypted and transmitted securely.

Access keys NCBI Homepage MyNCBI Homepage Main Content Main Navigation
. 2016 Dec;139(Pt 12):3217-3236.
doi: 10.1093/brain/aww238. Epub 2016 Sep 27.

A de novo compound targeting α-synuclein improves deficits in models of Parkinson's disease

Affiliations

A de novo compound targeting α-synuclein improves deficits in models of Parkinson's disease

Wolfgang Wrasidlo et al. Brain. 2016 Dec.

Erratum in

Abstract

Abnormal accumulation and propagation of the neuronal protein α-synuclein has been hypothesized to underlie the pathogenesis of Parkinson's disease, dementia with Lewy bodies and multiple system atrophy. Here we report a de novo-developed compound (NPT100-18A) that reduces α-synuclein toxicity through a novel mechanism that involves displacing α-synuclein from the membrane. This compound interacts with a domain in the C-terminus of α-synuclein. The E83R mutation reduces the compound interaction with the 80-90 amino acid region of α-synuclein and prevents the effects of NPT100-18A. In vitro studies showed that NPT100-18A reduced the formation of wild-type α-synuclein oligomers in membranes, reduced the neuronal accumulation of α-synuclein, and decreased markers of cell toxicity. In vivo studies were conducted in three different α-synuclein transgenic rodent models. Treatment with NPT100-18A ameliorated motor deficits in mThy1 wild-type α-synuclein transgenic mice in a dose-dependent manner at two independent institutions. Neuropathological examination showed that NPT100-18A decreased the accumulation of proteinase K-resistant α-synuclein aggregates in the CNS and was accompanied by the normalization of neuronal and inflammatory markers. These results were confirmed in a mutant line of α-synuclein transgenic mice that is prone to generate oligomers. In vivo imaging studies of α-synuclein-GFP transgenic mice using two-photon microscopy showed that NPT100-18A reduced the cortical synaptic accumulation of α-synuclein within 1 h post-administration. Taken together, these studies support the notion that altering the interaction of α-synuclein with the membrane might be a feasible therapeutic approach for developing new disease-modifying treatments of Parkinson's disease and other synucleinopathies.

Keywords: Parkinson’s disease; alpha-synuclein; cellular mechanisms; experimental models; synucleinopathy.


Figures

Figure 1
Figure 1
Molecular dynamics modelling studies of the mechanisms of NPT100–18A interactions with α-synuclein in lipid membranes. (A) Frequent place of binding of NPT100–18A. The compound mimics one of the regions of α-synuclein that most frequently binds to anther α-synuclein molecule during oligomerization leading to annular structures. (B) Close-up of the region in A. Residues interacting between the neighbouring α-synuclein molecules in the dimer that propagates to an annular oligomer. (C) Close-up of the region in A and B. The NPT100-18A is presented as a space-filling model with the atoms colour-coded by the type: red, oxygen; blue, nitrogen; green, carbon. (D) Energies of interaction for the membrane and α-synuclein dimers are significantly less favourable in the presence of NPT100-18A indicating that α-synuclein was less likely to propagate to annular structures. (E) Frequent binding location for NPT100–18A on the E83R α-synuclein mutant. In this case the mutation most likely alters the α-synuclein molecule, which resulted in abolishment of compound activity. (F) Magnification of residues that interacts between the mutant α-synuclein molecules. (G) Frequent position of the compound on the α-synuclein molecule. (H) Energies of interaction with the membrane of α-synuclein dimers that propagate to higher oligomers did not diminish despite compound binding. (I) Scheme of the compound function. The dimers and trimers created on the surface of the membrane can propagate to the annular structures or in the presence of the compound (red pentagon) the α-synuclein conformation changed effecting the formation of dimers and trimers in the membrane. ***P < 0.01 by Student t-test. wt = wild-type.
Figure 2
Figure 2
HSQC-based NMR characterization of the effects of NPT100-18A on α-synuclein lipid binding. (A) Series of HSQC spectra demonstrating that the addition of NPT100-18A (purple) to free α-synuclein (red) does not change the spectrum, while addition of liposomes (black) leads to a signal reduction that can be reversed by NPT100-18A (blue); the number in the box to the right represents the mean for each spectra. (B) Analysis of signal intensity for the spectra of free- and liposome-bound α-synuclein in the presence or absence of NPT100-18A. (C) NPT100-18A concentration dependence of liposome displacement for α-synuclein compared at different POPG:α-synuclein ratios. A clear shift towards lower apparent Kd values and more sigmoidality (cooperativity) can be seen when the POPG:α-synuclein ratio is decreased (higher local α-synuclein concentration on the membrane and thus more pronounced α-synuclein oligomer formation). The blue and green curves were recorded at the same ratio, while the total concentration was doubled in the green curve. This excludes the possibility of POPG concentration dependence (lines are fits with the Hill equation performed as a guide). All measurements apart from green with 200 µM α-synuclein, POPG concentrations were 0.8 mg/ml, 0.4 mg/ml and 0.2 mg/ml for black, red and blue, respectively (pH = 6.5). (D) NPT100-18A concentration dependence of liposome displacement for wild-type α-synuclein and the mutant E83R. Increasing concentration of NPT100-18A leads to more displacement of α-synuclein from the liposome (observed as an increase in signal intensity). Here the average value of the relative signal intensities from available resolved residues in the region 40–90 was plotted against the ligand concentration. The strong difference between wild-type (wt) and mutant (E83) in response to the ligand can easily be observed (dashed lines are fits with the Hill equation performed as a guide only).
Figure 3
Figure 3
In vitro analysis of the effects of NPT100-18A on α-synuclein oligomerization and toxicity. (A) Electron microscopic analysis of the effects of NPT100-18A (2 µM) on the formation of ring-like wild-type α-synuclein oligomers in a lipid membrane matrix. (B) Computer aided image analysis showing that NPT100-18A reduces ring-like oligomers with wild-type α-synuclein. (C) Electron microscopic analysis of the effects of NPT100-18A on E83R α-synuclein in a lipid membrane matrix. (D) Computer aided image analysis showing that NPT100-18A does not reduce ring-like E83R α-synuclein oligomers. (E) Immunogold (10 nm) electron microscopic analysis with a monoclonal antibody against human α-synuclein to evaluate the effects of NPT100-18A of the formation of ring-like wild-type α-synuclein oligomers in a lipid membrane matrix. (F) NPT100-18A significantly reduced the number of gold particles *P < 0.05 versus vehicle-treated α-synuclein wild-type group by Student t-test. (G) Immunogold electron microscopic analysis with a monoclonal antibody against human α-synuclein to evaluate the effects of NPT100-18A of the formation of ring-like E83R α-synuclein oligomers in a lipid membrane matrix. (H) NPT100-18A did not affect the number of gold particles. (I) Primary neuronal cultures from rat (embryonic Day 18) neocortex were infected with LV-control, LV-wild-type or E83R α-synuclein and treated with NPT100-18A at 1 µM. Cells in the upper row were immunostained with an antibody against α-synuclein and developed with diaminobenzidine. Cells in the lower panel were double labelled with antibodies against synapsin-1 and MAP2 and imaged with the laser scanning confocal microscope. (J) Computer aided analysis of levels of α-synuclein showing increased immunoreactivity in cells infected with wild-type and E83R α-synuclein. Compared to vehicle, treatment with NPT100-18A reduced the accumulation of wild-type but not E83R α-synuclein in primary neurons. (K) Computer aided Scholl image analysis of the length of MAP2 immunoreactive neurites showing decreased neurite lengths in cells infected with wild-type and E83R α-synuclein. Treatment with NPT100-18A recovered neuritic length in cells expressing wild-type but not E83R α-synuclein. Statistical analysis for A–H performed using Student t-test, *P < 0.05. Statistical analysis for J–K performed using one-way ANOVA, *P < 0.05 versus vehicle-treated control group using Dunnett’s post hoc comparison and #P < 0.05 versus vehicle-treated α-synuclein cells using Tukey-Kramer post hoc comparison; error bars are SEM; three replicates per group. Scale bar in A, C, E and G = 100 Å; I = 10 µm.
Figure 4
Figure 4
Effects of NPT100-18A on behavioural performance on α-synuclein transgenic mice at two independent sites. Comparable groups of mThy1-α-syn were treated for 3 months with vehicle (saline) or NPT100-18A at UCSD (A and B) and UCLA (C–F) and tested in the evaluations of motor behaviour in beam and open field tests. (A) Evaluation of round beam performance test at UCSD. Compared to non-transgenic, the vehicle-treated α-synuclein transgenic (tg) mice displayed significant deficits in the round horizontal beam test (****P < 0.0001, when compared to vehicle-treated non-transgenic group). Treatment with NPT100-18A ameliorated the deficits at 10 and 20 mg/kg (#P < 0.05, ###P < 0.01 compared to vehicle-treated α-synuclein transgenic mice). (B) Evaluation of spontaneous locomotor activity (open field) at UCSD. α-Synuclein transgenic mice displayed increased total activity in the open field test compared to non-transgenic controls (P < 0.001), but no statistically significant effects of NPT100-18A were detected. (C) Longitudinal evaluation of challenging beam performance at UCLA. Compared to non-transgenic littermates, the vehicle-treated α-synuclein transgenic mice displayed significant deficits in the challenging (grid) beam test conducted at UCLA (C, errors per step, group averages of five trials, ****P < 0.0001 when compared to vehicle-treated non-transgenic group). NPT100-18A treatment (10 mg/kg) decreased α-synuclein transgenic error rates on the challenging beam in 4.4- (C, middle) and 6.2- (C, right) month-old mice after 1 month of treatment (errors per step, group averages of five trials, #P < 0.05 versus vehicle-treated α-synuclein transgenic group). (D) Analysis of UCLA evaluation of α-synuclein transgenic challenging beam performance at 4.4 months (after 1 month of treatment) demonstrated that vehicle (saline)-treated wild-type α-synuclein mice had a statistically significant increase in the error rate for all trials compared to non-transgenic vehicle-treated mice (****P < 0.0001). NPT100-18A-treated α-synuclein transgenic mice had a statistically significant reduction in error rates on Trials 2, 4, and 5 of 5 (#P < 0.05, ###P < 0.01 compared to vehicle-treated α-synuclein transgenic mice). (E and F) Open field assessment of locomotor activity. There were no statistically significant effects of NPT100-18A on α-synuclein transgenic total move time in the open field locomotor test averaged over 15 min (E); however, NPT100-18A-treated α-synuclein transgenic showed habituation in the open field (F), with significantly decreased activity in the third time bin compared to vehicle-treated α-synuclein transgenic mice. Non-transgenic (vehicle n = 21 and NPT100-18A n = 22) and α-synuclein transgenic mice (vehicle n = 22 and NPT100-18A n = 20), all mice were 6.2-month-old males treated for 3 months with NPT100-18A or vehicle (saline). Error bars are SEM.
Figure 5
Figure 5
Immunocytochemical and western blot analysis of the effects of NPT100-18A on α-synuclein accumulation in transgenic mice. Groups of mThy1-wt-α-syn were treated for 3 months with vehicle or NPT100-18A at 20 mg/kg and analysed for levels of α-synuclein by immunocytochemistry and immunoblot. (A) Immunocytochemical analysis with a polyclonal antibody against full-length α-synuclein (FL). The column to the left is a low power view (20×) illustrating immunostaining of the neocortex (Nctx), hippocampus (Hipp) and striatum (Str) in each of the four groups analysed. The panels to the right illustrate a higher magnification view (630×) of the regions in open squares plus the substantia nigra. The images depict α-synuclein immunostaining of the neuropil in the non-transgenic mice and of the neuropil and neuropil and neuronal cells bodies (arrows) in the α-synuclein transgenic mice. (B–E) Computer aided image analysis of levels of α-synuclein in the frontal cortex, hippocampus, striatum and substantia nigra, respectively, showing greater accumulation of α-synuclein in the neuropil and cell bodies in the transgenic mice that were reduced with NPT100-18A treatment. (F) Immunoblot analysis with a polyclonal antibody against full-length α-synuclein with frontal cortex homogenates run on SDS-PAGE gels. In non-transgenic mice, a 14 kDa band that was primarily detected, while in the α-synuclein transgenic mice several bands corresponding to α-synuclein dimers and oligomers were detected. (G) Computer aided image analysis indicated that while the monomer was unaffected, the (H) dimer, and (I) higher molecular weight bands were significantly reduced by NPT100-18A in α-synuclein transgenic mice. (J) Immunoblot analysis with polyclonal antibodies against human α-synuclein with frontal cortex homogenates divided into cytosolic and membrane fractions run in SDS-PAGE gels. In vehicle-treated α-synuclein transgenic mice the 14 kDa band was more abundant in the membrane fraction, treatment with NPT100-18A shifted α-synuclein from the membrane (insoluble) to the cytosolic fraction (soluble). (K) Computer aided image analysis of a composite of α-synuclein in the membrane versus cytosolic fractions showing that NPT100-18A increased cytosolic α-synuclein while decreasing α-synuclein in the membrane fraction. (L) Immunoblot analysis of a polyclonal antibody against full-length α-synuclein with frontal cortex homogenates run in native gels. A band (arrow) as well as a smear were detected in the α-synuclein transgenic mice. Non-transgenic (vehicle n = 21 and NPT100-18A n = 22) and α-synuclein transgenic mice (vehicle n = 22 and NPT100-18A n = 20), all 3-month-old males treated for 3 months with NPT100-18A. ***P < 0.05 versus non-transgenic mice by one-way ANOVA with post hoc comparisons via Dunnett’s; ###P < 0.05 versus vehicle-treated α-synuclein transgenic mice by one-way ANOVA with post hoc comparisons via Tukey-Kramer. Error bars are SEM.
Figure 6
Figure 6
Neuropathological analysis of the effects of NPT100-18A on neurodegeneration in α-synuclein transgenic mice. Groups of mThy1-wt-α-syn were treated for 3 months with vehicle or NPT100-18A at 20 mg/kg and were analysed by immunocytochemistry for markers of neurodegeneration. (A) The top two rows are representative images at low power (20×) for sections immunostained with a neuronal (NeuN) and an astroglial cell marker (GFAP) reacted with diaminobenzidine and imaged with a digital bright field video microscope. The bottom two rows are representative images at higher power (900×) for sections immunostained with a presynaptic (synaptophysin) and a dendritic marker (MAP2) visualized with tyramide red and FITC, respectively, and imaged with a laser scanning confocal microscope. (B) Stereological analysis of NeuN positive cells in the frontal cortex and striatum showing reduced numbers in vehicle α-synuclein transgenic mice, which were recovered with NPT100-18A. (C) Densitometrical analysis of levels of GFAP immunoreactivity in the frontal cortex and striatum showing increased levels in vehicle α-synuclein transgenic mice and recovery with NPT100-18A. (D and E) Computer aided image analysis of the per cent area of the neuropil for synaptophysin (red) and MAP2 (green), respectively, in the frontal cortex and striatum showing decreased levels in vehicle α-synuclein transgenic mice and recovery with NPT100-18A. Arrows indicate damaged dendritic processes, n = nucleus. (F) The top row shows representative images at low power (20×) of the substantia nigra immunostained with an antibody against TH. The bottom row shows representative images at higher power (240×) of the striatum reacted with diaminobenzidine and imaged with a digital bright field video microscope. (G) Stereological counts of TH neurons in the substantia nigra (hemibrain). Densitometric analysis of TH fibres in the striatum showing decrease levels in vehicle α-synuclein transgenic mice and recovery with NPT100-18A. *P < 0.05; **P < 0.01; ***P < 0.001 versus non-transgenic mice by one way ANOVA with post hoc Dunnett’s; #P < 0.05; ##P < 0.01; ###P < 0.05 versus vehicle-treated α-synuclein transgenic mice by one-way ANOVA with post hoc Tukey-Kramer. Non-transgenic vehicle (n = 24), non-transgenic NPT100-18A (20 mg/kg, n = 17), α-synuclein transgenic vehicle (n = 20), α-synuclein transgenic 20 mg/kg (n = 13). Scale bars: low magnification bar = 250 µm and high magnification bar = 25 µm. Error bars are SEM.
Figure 7
Figure 7
Immunoblot and immunocytochemical analysis of the effects of NPT100-18A on oligomer prone E57K α-synuclein transgenic mice. Groups of mThy1-E57K- α-synuclein transgenic mice were treated for 3 months with vehicle or NPT100-18A at 20 mg/kg and analysed by western blot and immunocytochemistry. (A) Immunoblot analysis with a polyclonal antibody against full-length α-synuclein with frontal cortex homogenates ran in SDS-PAGE gel, E57K α-synuclein transgenic mice show the presence of several bands between 28 to 70 kDa corresponding to α-synuclein multimers (oligomers). (B) Computer aided image analysis of the monomer and higher molecular weight bands showing that NPT100-18A reduced dimer in α-synuclein transgenic mice but had no effects on monomer levels. (C) Immunocytochemical analysis with a polyclonal antibody against full-length α-synuclein showing representative images illustrating immunostaining of the neocortex (Nctx) and striatum (Str) in the each of the four groups analysed at a high magnification view (630×). The images depict α-synuclein immunostaining of the neuropil in the non-transgenic mice and of the neuropil and dystrophic neurites (arrows). (D) Computer aided image analysis of levels of α-synuclein in the frontal cortex, and striatum showing greater accumulation of α-synuclein in the neuropil in the transgenic mice that was reduced with NPT100-18A treatment. (E) Immunocytochemical analysis with a monoclonal antibody against truncated α-synuclein; the column to the left is a low power view (20×), and the panels to the right are higher magnification view (630×). The E57K α-synuclein transgenic mice display strong immunostaining in the neuropil and dystrophic neurites (arrows). (F) Computer aided image analysis of levels of C-terminus truncated α-synuclein in the frontal cortex, and striatum showing greater accumulation of α-synuclein in the neuropil in the transgenic mice that is reduced with NPT100-18A treatment. (G) Double labelling with antibodies against C-terminus truncated α-synuclein (red) and the synaptic marker synaptophysin (green) and imaged with the laser scanning microscope. Arrows indicate co-localization between the two markers. (H) Image analysis of the per cent of synaptophysin terminals containing C-terminus truncated α-synuclein showing greater accumulation of α-synuclein in synapses in the transgenic mice that is reduced with NPT100-18A treatment. ***P < 0.05 versus non-transgenic mice by one-way ANOVA with post hoc Dunnett’s. ###P < 0.05 versus vehicle-treated α-synuclein transgenic mice by one-way ANOVA with post hoc Tukey-Kramer. Non-transgenic vehicle (n = 12), non-transgenic NPT100-18A (20 mg/kg, n = 12), α-synuclein transgenic vehicle (n = 12), α-synuclein transgenic 20 mg/kg (n = 12). Error bars are SEM. Scale bar = 15 µm.
Figure 8
Figure 8
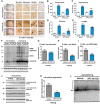
Two-photon live imaging of the effects of NPT100-18A on α-synuclein accumulation in synapses in α-syn-GFP transgenic mice. Groups of α-syn-GFP transgenic mice were anaesthetized, a window was opened in the skull, and the neocortex was imaged for a period of over 2 h with a two-photon microscope. (A) Acute evaluation of vehicle-treated α-syn-GFP transgenic mice, the punctae (green, arrowheads) represent individual synaptic terminals containing α-synuclein. The brains were counter-stained with the glial marker SR101 (red). (B) Computer aided image analysis of presynaptic terminals (numbered arrowheads) over time showing the levels of fluorescence were stable. (C) NPT100-18A-treated α-syn-GFP transgenic mice, the punctae (green, arrowheads) represent individual synaptic terminals containing α-synuclein, the brains were counter-stained with the glial marker SR101 (red). Over time, following acute NPT100-18A treatment (time = 0 min), the levels decrease in some of terminals. (D) Computer aided image analysis of α-syn-GFP terminals (numbered arrowheads) over time showing the decay in levels of fluorescence following NPT100-18A. (E) Data from a representative animal showing fluorescence levels decreasing with time from 15 min before treatment to 150 min post-treatment across depth up to 100 µm. Fluorescence levels naturally decrease with increasing depth despite increasing the laser power since there is more tissue above the focal plane. (F) Particle size analysis in chronically treated mice. Binning of particle data (in this case the particle is GFP α-synuclein in nerve terminals) was performed to characterize a statistical distribution of particle size. NPT100-18A decreased the number of particles in the smallest bin. A total of 12 transgenic mice (6 months old, n = 6 vehicle and n = 6 NPT100-18A) were used; error bars are SEM. *P < 0.05 versus the respective binned particle size group for vehicle treated mice by one-way ANOVA followed by Dunnett’s post hoc analysis.

Comment in

Similar articles

Cited by

References

    1. Alvarez-Castelao B, Goethals M, Vandekerckhove J, Castano JG. Mechanism of cleavage of alpha-synuclein by the 20S proteasome and modulation of its degradation by the RedOx state of the N-terminal methionines. Biochim Biophys Acta 2014; 1843: 352–65. - PubMed
    1. Ardah MT, Paleologou KE, Lv G, Abul Khair SB, Kazim AS, Minhas ST, et al. Structure activity relationship of phenolic acid inhibitors of alpha-synuclein fibril formation and toxicity. Front Aging Neurosci 2014; 6: 197. - PMC - PubMed
    1. Bar-On P, Crews L, Koob AO, Mizuno H, Adame A, Spencer B, et al. Statins reduce neuronal alpha-synuclein aggregation in in vitro models of Parkinson's disease. J Neurochem 2008; 105: 1656–67. - PMC - PubMed
    1. Bartels T, Choi JG, Selkoe DJ. α-Synuclein occurs physiologically as a helically folded tetramer that resists aggregation. Nature 2011; 477: 107–10. - PMC - PubMed
    1. Beyer K. Mechanistic aspects of Parkinson's disease: alpha-synuclein and the biomembrane. Cell Biochem Biophys 2007; 47: 285–99. - PubMed

Publication types