Breeding Young as a Survival Strategy during Earth's Greatest Mass Extinction
- PMID: 27044713
- PMCID: PMC4820772
- DOI: 10.1038/srep24053
Breeding Young as a Survival Strategy during Earth's Greatest Mass Extinction
Abstract
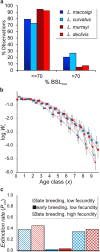
Studies of the effects of mass extinctions on ancient ecosystems have focused on changes in taxic diversity, morphological disparity, abundance, behaviour and resource availability as key determinants of group survival. Crucially, the contribution of life history traits to survival during terrestrial mass extinctions has not been investigated, despite the critical role of such traits for population viability. We use bone microstructure and body size data to investigate the palaeoecological implications of changes in life history strategies in the therapsid forerunners of mammals before and after the Permo-Triassic Mass Extinction (PTME), the most catastrophic crisis in Phanerozoic history. Our results are consistent with truncated development, shortened life expectancies, elevated mortality rates and higher extinction risks amongst post-extinction species. Various simulations of ecological dynamics indicate that an earlier onset of reproduction leading to shortened generation times could explain the persistence of therapsids in the unpredictable, resource-limited Early Triassic environments, and help explain observed body size distributions of some disaster taxa (e.g., Lystrosaurus). Our study accounts for differential survival in mammal ancestors after the PTME and provides a methodological framework for quantifying survival strategies in other vertebrates during major biotic crises.
Figures


Similar articles
-
The rise of the ruling reptiles and ecosystem recovery from the Permo-Triassic mass extinction.Proc Biol Sci. 2018 Jun 13;285(1880):20180361. doi: 10.1098/rspb.2018.0361. Proc Biol Sci. 2018. PMID: 29899066 Free PMC article.
-
Ecological dynamics of terrestrial and freshwater ecosystems across three mid-Phanerozoic mass extinctions from northwest China.Proc Biol Sci. 2021 Mar 31;288(1947):20210148. doi: 10.1098/rspb.2021.0148. Epub 2021 Mar 17. Proc Biol Sci. 2021. PMID: 33726593 Free PMC article.
-
Evidence from South Africa for a protracted end-Permian extinction on land.Proc Natl Acad Sci U S A. 2021 Apr 27;118(17):e2017045118. doi: 10.1073/pnas.2017045118. Proc Natl Acad Sci U S A. 2021. PMID: 33875588 Free PMC article.
-
Rapid turnover of top predators in African terrestrial faunas around the Permian-Triassic mass extinction.Curr Biol. 2023 Jun 5;33(11):2283-2290.e3. doi: 10.1016/j.cub.2023.04.007. Epub 2023 May 22. Curr Biol. 2023. PMID: 37220743 Review.
-
Permian-Triassic Osteichthyes (bony fishes): diversity dynamics and body size evolution.Biol Rev Camb Philos Soc. 2016 Feb;91(1):106-47. doi: 10.1111/brv.12161. Epub 2014 Nov 27. Biol Rev Camb Philos Soc. 2016. PMID: 25431138 Review.
Cited by
-
Geometric morphometric analysis of an ontogenetic cranial series of the Permian dicynodont Diictodon feliceps.Proc Biol Sci. 2024 Jul;291(2027):20240626. doi: 10.1098/rspb.2024.0626. Epub 2024 Jul 31. Proc Biol Sci. 2024. PMID: 39081192 Free PMC article.
-
Fossil bone histology reveals ancient origins for rapid juvenile growth in tetrapods.Commun Biol. 2022 Nov 28;5(1):1280. doi: 10.1038/s42003-022-04079-0. Commun Biol. 2022. PMID: 36443424 Free PMC article.
-
Living fast in the Triassic: New data on life history in Lystrosaurus (Therapsida: Dicynodontia) from northeastern Pangea.PLoS One. 2021 Nov 5;16(11):e0259369. doi: 10.1371/journal.pone.0259369. eCollection 2021. PLoS One. 2021. PMID: 34739492 Free PMC article.
-
What's my age again? On the ambiguity of histology-based skeletochronology.Proc Biol Sci. 2021 Jul 28;288(1955):20211166. doi: 10.1098/rspb.2021.1166. Epub 2021 Jul 21. Proc Biol Sci. 2021. PMID: 34284632 Free PMC article.
-
Intraskeletal bone growth patterns in the North Island Brown Kiwi (Apteryx mantelli): Growth mark discrepancy and implications for extinct taxa.J Anat. 2021 Nov;239(5):1075-1095. doi: 10.1111/joa.13503. Epub 2021 Jul 13. J Anat. 2021. PMID: 34258760 Free PMC article.
References
-
- Jablonski D. Mass extinctions and macroevolution. Paleobiol. 31, 192–210 (2005).
-
- Arche A. & López-Gómez J. Sudden changes in fluvial style across the Permian-Triassic boundary in the eastern Iberian Ranges, Spain: Analysis of possible causes. Palaeogeogr. Palaeoclimatol. Palaeoecol. 229, 104–126 (2005).
Publication types
MeSH terms
LinkOut - more resources
Full Text Sources
Other Literature Sources


