iBet uBet web content aggregator. Adding the entire web to your favor.


Link to original content: https://pubmed.ncbi.nlm.nih.gov/26689363
Structure of the voltage-gated two-pore channel TPC1 from Arabidopsis thaliana - PubMed Skip to main page content
U.S. flag

An official website of the United States government

Dot gov

The .gov means it’s official.
Federal government websites often end in .gov or .mil. Before sharing sensitive information, make sure you’re on a federal government site.

Https

The site is secure.
The https:// ensures that you are connecting to the official website and that any information you provide is encrypted and transmitted securely.

Access keys NCBI Homepage MyNCBI Homepage Main Content Main Navigation
. 2016 Mar 10;531(7593):196-201.
doi: 10.1038/nature16446. Epub 2015 Dec 21.

Structure of the voltage-gated two-pore channel TPC1 from Arabidopsis thaliana

Affiliations

Structure of the voltage-gated two-pore channel TPC1 from Arabidopsis thaliana

Jiangtao Guo et al. Nature. .

Abstract

Two-pore channels (TPCs) contain two copies of a Shaker-like six-transmembrane (6-TM) domain in each subunit and are ubiquitously expressed in both animals and plants as organellar cation channels. Here we present the crystal structure of a vacuolar two-pore channel from Arabidopsis thaliana, AtTPC1, which functions as a homodimer. AtTPC1 activation requires both voltage and cytosolic Ca(2+). Ca(2+) binding to the cytosolic EF-hand domain triggers conformational changes coupled to the pair of pore-lining inner helices from the first 6-TM domains, whereas membrane potential only activates the second voltage-sensing domain, the conformational changes of which are coupled to the pair of inner helices from the second 6-TM domains. Luminal Ca(2+) or Ba(2+) can modulate voltage activation by stabilizing the second voltage-sensing domain in the resting state and shift voltage activation towards more positive potentials. Our Ba(2+)-bound AtTPC1 structure reveals a voltage sensor in the resting state, providing hitherto unseen structural insight into the general voltage-gating mechanism among voltage-gated channels.


Figures
Extended Data Figure 1
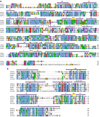
Extended Data Figure 1. Sequence analysis
a, Sequence alignment of AtTPC1, human TPC1 (HsTPC1) and TPC2 (HsTPC2). Secondary structure assignments are based on the AtTPC1 structure. Red dots indicate the residues predicted to participate in calcium coordination in EF-hand domain. b, Sequence alignment of the two 6-TM domains of AtTPC1 (AtTPC1I and AtTPC1II), NavRh (PDB: 4DXW), NavAb (PDB: 3RVY) and Kv1.2–2.1 (PDB: 2R9R). Red dots indicate the residues critical for voltage sensing. Secondary structure assignments are based on the AtTPC1 6-TM I structure.
Extended Data Figure 2
Extended Data Figure 2. Voltage activation and Ba2+ modulation of AtTPC1 over-expressed in HEK cell
a, Voltage dependent activation of wild-type AtTPC1. Channel currents were recorded using patch clamp in the whole-cell configuration. The membrane was stepped from holding potential (−70 mV) to various testing potentials and then returned to the holding potential. The I–V curve was plotted using the steady peak current against the voltage. The peak tail currents were recorded to generate the G-V curves for voltage activation analysis. b, Extracellular Ba2+ inhibition of AtTPC1. The intracellular solution (pipette) contains 300 µM Ca2+ necessary for channel activation.
Extended Data Figure 3
Extended Data Figure 3. Structure of AtTPC1 transmembrane region and its alignment with prokaryotic Nav channels
a, Structure of the individual 6-TM domain of AtTPC1 in rainbow color with the same pore orientation. b, Superposition of AtTPC1 (red) and NavRh (blue, PDB: 4DXW). The NavRh VSDs align well with AtTPC1 VSD1s. c, Superposition of AtTPC1 (red) and NavAb (cyan, PDB: 3RVY). The NavAb VSDs align well with AtTPC1 VSD2s. d, Pore superposition between AtTPC1 (red) and NavRh (blue). e, Pore superposition between AtTPC1 (red) and NavAb (cyan).
Extended Data Figure 4
Extended Data Figure 4. The ion conduction pore of AtPTC1
a, Cross sections of surface rendered AtTPC1 pore along IS6 pair (left) and IIS6 pair (right). The channel is closed at the bundle crossing. b, Stereo view of the bundle crossing region from the cytosolic side. c, Partial sequence alignment of the selectivity filters from two pore channels (AtTPC1, HsTPC1 and HsTPC2), bacterial sodium channels (NavRh and NavAb) and human voltage-gated sodium channel Nav1.1. d, Stereo view of the structural alignment between AtTPC1 Filter I (carbon in yellow) and NavAb filter (carbon in cyan). e, Stereo view of structural alignment between AtTPC1 Filter II and NavAb filter. f, Anomalous difference Fourier map of native crystal (green mesh, 4.5 σ level) reveals the bound Ba2+ along the ion conduction pathway. The two cavity sites are likely occupied by a single Ba2+ ion alternatively, as the two sites are only 3 Å apart, too close to accommodate two ions simultaneously.
Extended Data Figure 5
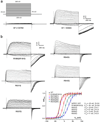
Extended Data Figure 5. The whole cell currents and G-V curves of AtTPC1 with mutations at the luminal Ba2+ binding sites
a–d are D454N, D240N, E528Q and E239Q, respectively. The bath solutions contained 0, 0.1, 1, or 10 mM [Ca2+]ext. The pipette solutions contained 300 µM [Ca2+]cyt. Data measured in 0.1 mM [Ca2+]ext are shown in the main text Fig. 4e.
Extended Data Figure 6
Extended Data Figure 6. Functional analysis of AtTPC1 mutants
a, The whole cell currents of AtTPC1 containing EF-hand Ca2+ site mutations (D335A in EF-1 and D376A in EF-2). Currents were recorded with the presence of 300 µM [Ca2+]cyt. b, Whole cell currents and G-V Curves of AtTPC1 neutralization mutations of arginines on IS4 and IIS4 of the voltage sensing domains.
Extended Data Figure 7
Extended Data Figure 7. Structural comparison between AtTPC1_VSD2, NavAb_VSD (PDB: 3RVY) and Kv1.2–2.1_VSD (PDB: 2R9R)
All structures are aligned at the gating charge transfer center and S1 helices are removed for clarity. The side chains of the voltage-sensing arginines in S4, residues in gating charge transfer center and the conserved acidic residue in S2 are shown in stick model. Voltage sensing residues in gating charge transfer center are labeled in red. Lower panels are cross sections of surface rendered AtTPC1 VSD2 (left) and NavAb VSD (right) with S4 gating charge arginines in blue. NavAb VSD is rotated by 90° to visualize the external aqueous cavity.
Extended Data Figure 8
Extended Data Figure 8. Proposed model for AtTPC1 activation
a, The model of AtTPC1 6-TM II in voltage-activated state is generated based on the structural comparison between AtTPC1 and NavAb. Only IIS4, IIS4–S5 linker and IIS6 are considered as the moving parts, assuming IIS6 moves concurrently with IIS4–S5 linker. The moving parts are colored red for resting state and blue for activated state. The rest of the protein is colored in grey. Green arrows indicate the directions of the movement at N-terminus, middle part, and C-terminus of IIS4, and at IIS4–S5 linker and C-terminus of IIS6. Dashed arrow indicates the central axis of the channel. b, Cytosolic view of the channel opening mechanism. Compared with the closed state (red), membrane depolarization and calcium binding to EF hand domain lead to the opening of IIS6 and IS6 (modeled in blue), respectively.
Extended Data Figure 9
Extended Data Figure 9. Structure determination of AtTPC1
a, Experimental electron density maps superposed with the final refined model. Density in blue (left) is the experimental SIRAS map calculated from the native and Hg-derivative data without anisotropic truncation and B-factor sharpening. Density in magenta (right) is the experimental SIRAS map calculated from the same native and Hg-derivative data after anisotropic truncation and B-factor sharpening using ‘auto correction’ in HKL2000. This map provides much better structural features, i.e. side chains. All maps are contoured at 1.5 σ level. b, Anomalous difference Fourier maps of Hg-derivatized native and mutant crystals superposed on the final refined model. The blue density peaks indicate the positions of Hg bound to the native cysteine residues. The magenta density peaks indicate the positions of Hg bound to cysteine residues introduced into various part of the protein (single-cysteine mutants). The green density peaks are calculated from the wild-type crystal (no Hg soaking), indicating the barium positions in wild type AtTPC1. All maps are contoured at 4 σ. Total 20 residues in each subunit are accurately registered by the mercury sites. Arrow indicates the central two-fold axis of the channel
Figure 1
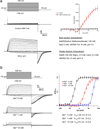
Figure 1. Voltage activation and Ca2+ modulation of AtTPC1 over-expressed in HEK cell
a, Cytosolic Ca2+-dependent voltage activation of AtTPC1. Currents were recorded with varying [Ca2+]cyto in pipette and calcium free in bath (extracellular). Boltzmann fit yields V1/2=−28mV, Z=3.9 for voltage activation in 300uM [Ca2+]cyt and V1/2=48mV, Z=1.9 in 100µM [Ca2+]cyt. b, Extracellular Ca2+ inhibition of AtTPC1. Currents were recorded with the presence of 300 µM [Ca2+]cyt (pipette) using the same protocol as a. V1/2=−28mV, Z=3.5 for 0 [Ca2+]ext; V1/2=33mV, Z=2.1 for 0.1mM [Ca2+]ext. c, Selectivity measurement of AtTPC1 with intracellular 150 mM Na+, 300 µM Ca2+, and extracellular 150 mM Na+ or K+, 0 mM Ca2+. Reversal potential remains unchanged when bath solution is switched from 150 mM Na+ to 150 mM K+.
Figure 2
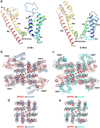
Figure 2. Overall structure of AtTPC1
a, Topology diagram of AtTPC1. b, Side view of an AtTPC1 channel dimer. 6-TM I, 6-TM II, and EF hands from one subunit are shown in green, red and orange, respectively, and from the other symmetry related subunit are shown in lime green, purple and light orange, respectively. The cytosolic EF-hand domains with bound Ca2+ (cyan sphere) in EF-1 are boxed and the two luminal Ba2+ (blue spheres labeled 1 and 2) binding sites are circled. c, AtTPC1 viewed from luminal side. d, Superposition between the two 6-TM domains using the pore domains in the alignment. The orientation of 6-TM I is the same as that in c.
Figure 3
Figure 3. The ion conduction pore
a, The ion conduction pore comprised of IS5–6 (left, green) and IIS5–6 (right, red). Ba2+ ions are shown as blue spheres. b, Structures of the selectivity filter formed by Filter I (left) and Filter II (right). c, Side view of the bundle crossing formed by IS6 pair (left) and IIS6 pair (right). Numbers are diagonal distances (in Å) of the constriction points.
Figure 4
Figure 4. The calcium modulation sites
a, Overall structure of the EF-hand domain with S0 and the C-terminal part of IS6 in green, and EF-hand helices in orange. Side chains are from residues predicted to participate in Ca2+ binding in EF-1 and EF-2. b, Packing interactions between S0 and E1/F1/F2. Residues contributing to the extensive hydrophobic contacts are: A34, L37, V38, L40, A41 and I45 on S0; A330, L333 and I334 on E1; L350 and L354 on F1; F388, C392 and A396 on F2. c, EF-1 Ca2+ (cyan sphere) coordination with anomalous difference Fourier map (blue mesh contoured at 3.5 σ). d, Luminal Ba2+ sites. Density from Ba2+ (magenta mesh at 11 σ) and Ca2+ (blue mesh at 6 σ) are defined by anomalous difference Fourier maps from native crystals grown with and without Ba2+, respectively. e, G-V curves of wild type AtTPC1 and mutations at luminal Ba2+ sites recorded in the presence and absence of 100 µM extracellular Ca2+. Wild type and mutant G-V curves recorded in the absence of Ca2+ are similar and only the wild type one is shown.
Figure 5
Figure 5. The voltage sensing domains
a, Partial S4 sequence alignment and arginine registry. b, Locations of VSD1, VSD2 and IIS4–S5 linker regions in AtTPC1. c, Side view of VSD1 with S1 omitted for clarity - same for VSD2. d, G-V curves of wild type AtTPC1 and neutralization mutations of arginines on IS4 and IIS4. e, Structure of VSD2 (left) and its surface rendered cross section (right). Grey double arrows indicate the three segments of the curved IIS4 helix. Arginine in the gating charge transfer center is labeled in red. f, Acute-angled connection between IIS4 and IIS4–S5 linker and the extensive interactions between the linker and IIS6. For clarity, the channel in b is rotated about 40° around the indicated axis.
Figure 6
Figure 6. Voltage gating mechanism
a, Side view of Cα superposition between AtTPC1 VSD2 (red) and NavAb VSD (cyan) with S1 omitted. Spheres indicate the Cα positions of critical residues for voltage-sensing. Distances are between Cα atoms of two equivalent S4 residues at the N-terminus (R1-R1), middle (R3-R3) and C-terminus (V122–V548). b and c, Luminal and cytosolic views of the superposition, respectively. d, Cartoon representation of the translational S4 movement from the resting to activated states with two gating charges transferred. Red arrows indicate the directions of the movement at N-, middle, and C-terminal parts of S4, and at S4–5 linker and C-terminus of S6. e, Cytosolic view of the superposition between AtTPC1 (red) and NavAb (cyan) excluding the VSD1s of AtTPC1 and the equivalent VSDs of NavAb. Major structural changes highlighted in circles occur at S4 and S4–S5 linker.

Similar articles

Cited by

References

    1. Peiter E, et al. The vacuolar Ca2+-activated channel TPC1 regulates germination and stomatal movement. Nature. 2005;434:404–408. - PubMed
    1. Calcraft PJ, et al. NAADP mobilizes calcium from acidic organelles through two-pore channels. Nature. 2009;459:596–600. - PMC - PubMed
    1. Hedrich R, Marten I. TPC1-SV channels gain shape. Mol Plant. 2011;4:428–441. - PubMed
    1. Xu H, Ren D. Lysosomal physiology. Annu Rev Physiol. 2015;77:57–80. - PMC - PubMed
    1. Rahman T, et al. Two-pore channels provide insight into the evolution of voltage-gated Ca2+ and Na+ channels. Science Signaling. 2014;7:ra109. - PMC - PubMed

Methods References

    1. Otwinowski Z, Minor W. Processing of X-ray Diffraction Data Collected in Oscillation Mode. Methods Enzymol. 1997;276(part A):307–326. Macromolecular Crystallography. - PubMed
    1. Strong M, et al. Toward the structural genomics of complexes: crystal structure of a PE/PPE protein complex from Mycobacterium tuberculosis. Proc Natl Acad Sci U S A. 2006;103:8060–8065. - PMC - PubMed
    1. Vonrhein C, Blanc E, Roversi P, Bricogne G. Automated structure solution with autoSHARP. Methods Mol Biol. 2007;364:215–230. - PubMed
    1. Schneider TR, Sheldrick GM. Substructure solution with SHELXD. Acta Crystallogr D Biol Crystallogr. 2002;58:1772–1779. - PubMed
    1. Fortelle Edl, Bricogne G. Maximum-likelihood heavy-atom parameter refinement for multiple isomorphous replacement and multiwavelength anomalous diffraction methods. Methods Enzymol. 1997;276(part A):472–494. Macromolecular Crystallography. - PubMed

Publication types

MeSH terms

Associated data