iBet uBet web content aggregator. Adding the entire web to your favor.


Link to original content: https://pubmed.ncbi.nlm.nih.gov/26431741/
Overexpression of the monocyte chemokine CCL2 in dorsal root ganglion neurons causes a conditioning-like increase in neurite outgrowth and does so via a STAT3 dependent mechanism - PubMed Skip to main page content
U.S. flag

An official website of the United States government

Dot gov

The .gov means it’s official.
Federal government websites often end in .gov or .mil. Before sharing sensitive information, make sure you’re on a federal government site.

Https

The site is secure.
The https:// ensures that you are connecting to the official website and that any information you provide is encrypted and transmitted securely.

Access keys NCBI Homepage MyNCBI Homepage Main Content Main Navigation
. 2016 Jan;275 Pt 1(0 1):25-37.
doi: 10.1016/j.expneurol.2015.09.018. Epub 2015 Nov 2.

Overexpression of the monocyte chemokine CCL2 in dorsal root ganglion neurons causes a conditioning-like increase in neurite outgrowth and does so via a STAT3 dependent mechanism

Affiliations

Overexpression of the monocyte chemokine CCL2 in dorsal root ganglion neurons causes a conditioning-like increase in neurite outgrowth and does so via a STAT3 dependent mechanism

Jon P Niemi et al. Exp Neurol. 2016 Jan.

Abstract

Neuroinflammation plays a critical role in the regeneration of peripheral nerves following axotomy. An injury to the sciatic nerve leads to significant macrophage accumulation in the L5 DRG, an effect not seen when the dorsal root is injured. We recently demonstrated that this accumulation around axotomized cell bodies is necessary for a peripheral conditioning lesion response to occur. Here we asked whether overexpression of the monocyte chemokine CCL2 specifically in DRG neurons of uninjured mice is sufficient to cause macrophage accumulation and to enhance regeneration or whether other injury-derived signals are required. AAV5-EF1α-CCL2 was injected intrathecally, and this injection led to a time-dependent increase in CCL2 mRNA expression and macrophage accumulation in L5 DRG, with a maximal response at 3 weeks post-injection. These changes led to a conditioning-like increase in neurite outgrowth in DRG explant and dissociated cell cultures. This increase in regeneration was dependent upon CCL2 acting through its primary receptor CCR2. When CCL2 was overexpressed in CCR2-/- mice, macrophage accumulation and enhanced regeneration were not observed. To address the mechanism by which CCL2 overexpression enhances regeneration, we tested for elevated expression of regeneration-associated genes in these animals. Surprisingly, we found that CCL2 overexpression led to a selective increase in LIF mRNA and neuronal phosphorylated STAT3 (pSTAT3) in L5 DRGs, with no change in expression seen in other RAGs such as GAP-43. Blockade of STAT3 phosphorylation by each of two different inhibitors prevented the increase in neurite outgrowth. Thus, CCL2 overexpression is sufficient to induce macrophage accumulation in uninjured L5 DRGs and increase the regenerative capacity of DRG neurons via a STAT3-dependent mechanism.

Keywords: CCL2; DRG; MCP-1; Macrophage; Neuroinflammation; Regeneration; STAT3.


Conflict of interest statement

Conflicts of Interest: None

Figures

Fig. 1
Fig. 1. Intrathecal injection of AAV5 infects lumbar DRG neurons and leads to a time-dependent overexpression of CCL2
Schematic of AAV5-EF1α-CCL2 vector. We used AAV5-EF1α-eYFP as a control (A). Representative images of AAV5-YFP localization in L4 (B) and L5 DRG (C) at 10×, visualized by anti-YFP labeling. High magnification image of YFP labeling in L5 DRG at 25× (C′). AAV5-YFP injection led to a 37.2% ± 5.7% DRG neuron infection efficiency. Representative image of sparse YFP axonal labeling in the sciatic nerve (D). A representative image of YFP localization in the lumbar spinal cord at low magnification (E) and high magnification (E′) shows preferential expression in the dorsal horn. Injection of AAV5-CCL2 resulted in a time-dependent overexpression of CCL2 mRNA in L5 DRG quantified using the ΔΔCt method normalized to GAPDH (F). For images: Scale bar=100 μm. For RT-PCR: n=5 per group. *p < 0.05. **p < 0.001.
Fig. 2
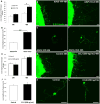
Fig. 2. CCL2 overexpression causes a time-dependent increase in CD11b- and CD68-positive macrophage accumulation in L5 DRGs
Immunohistochemical labeling of DRG sections with an antibody against CD11b (A) or CD68 (F) shows significant increases at 2, 3, and 4 wk after injection of AAV5-CCL2 compared to AAV5-YFP (A,F). Data were quantified as a percentage of the tissue area positively immuno-labeled. Representative images of CD11b staining in L5 DRG 1, 2, 3, and 4 wk after intrathecal injection of AAV5-CCL2 (B–E). Representative images of CD68 staining in L5 DRG 1, 2, 3, and 4 wk after intrathecal injection of AAV5-CCL2 (G–J). Inset images taken at 63×. Scale bar=100 μm. n=5 per group. *p < 0.05. **p < 0.001.
Fig. 3
Fig. 3. A conditioning-like increase in neurite outgrowth from DRG neurons is observed with in vivo CCL2 overexpression but not after exogenous CCL2 addition at the time of culturing
Quantification of neurite outgrowth in explant culture measured after 24 and 48 h, 3 wk after intrathecal injection of AAV5-CCL2 or AAV5-YFP (A). Data is represented as the mean length, in microns, of the 20 longest neurites. Representative images of neurite outgrowth after 48 h in explant culture, visualized with βIII tubulin, for AAV5-YFP (B) and AAV5-CCL2 (C). Quantification of neurite outgrowth in dissociated cell culture measured at 24 h, 3 wk after intrathecal injection of AAV5-CCL2 or AAV5-YFP (D). Representative images of neurite outgrowth in dissociated cell culture at 24 h for AAV5-YFP (E) and AAV5-CCL2 (F). Quantification of neurite outgrowth in WT DRG explant culture measured after 24 and 48 h, with or without exogenous CCL2 (200 ng/mL) added to the culture medium at the time of plating (G). Representative images of neurite outgrowth after 48 h in culture for control (H) and exogenous CCL2 (I). Quantification of neurite outgrowth in WT DRG dissociated cell culture at 24 h, with or without exogenous CCL2 (200 ng/mL) added to the culture medium at the time of plating (J). Representative images of neurite outgrowth in dissociated cell culture for control (K) and exogenous CCL2 (L). Scale bar=100 μm. For CCL2 overexpression explant cultures: n=4 per group. *p < 0.05. For CCL2 overexpression dissociated cell cultures: n=180-251 neurons per group. **p < 0.001. For exogenous CCL2 explant cultures: n=6 per group. For exogenous CCL2 dissociated cell cultures: n=253–397 neurons per group.
Fig. 4
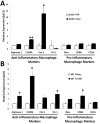
Fig. 4. Two anti-inflammatory macrophage markers and no pro-inflammatory markers are significantly increased in uninjured L5 DRGs 3 wk after intrathecal injection of AAV5-CCL2
Relative expression of mRNA for 4 anti-inflammatory [arginase 1, CD206, Fizz1, and Ym1] and 3 pro-inflammatory [iNos, CD86, CD16] macrophage markers in L5 DRGs 3 wk after injection of AAV5-CCL2 or AAV5-YFP (A) or 7 d after SNI in WT mice compared to sham controls (B). Data was quantified using the ΔΔCt method normalized to GAPDH. n=5 per group. *p < 0.05. **p < 0.001.
Fig. 5
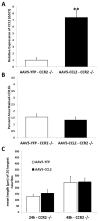
Fig. 5. Overexpression of CCL2 in CCR2 −/− mice does not cause macrophage accumulation or increased neurite outgrowth in L5 DRGs
Expression of CCL2 mRNA measured 3 wk after intrathecal injection of AAV5-CCL2 or AAV5-YFP in CCR2 −/− mice, quantified using the ΔΔCt method normalizing to GAPDH (A). Immunohistochemical labeling of DRG sections with an antibody against CD11b shows no difference between AAV5-CCL2 and AAV5-YFP 3 wk after injection (B). Data was quantified as a percentage of the imaged area positively immuno-labeled. Quantification of neurite outgrowth in explant culture measured at 24 and 48 h, 3 wk after intrathecal injection of AAV5-CCL2 or AAV5-YFP in CCR2 −/− mice (C). Data are represented as the mean length, in microns of the 20 longest neurites. For RT-PCR: n=5 per group. **p < 0.001. For IHC: n=5 per group. For explant cultures: n=5 per group.
Fig. 6
Fig. 6. LIF mRNA and pSTAT3 are significantly increased in uninjured L5 DRGs 3 wk after intrathecal injection of AAV5-CCL2
Relative expression of various RAGs in L5 DRGs 3 wk after intrathecal virus infection of uninjured DRGs quantified using the ΔΔCt method normalizing to GAPDH (A). Relative expression of various RAGs in L5 DRGs 7 d after SNI in WT mice compared to sham controls (B). Representative images of pSTAT3 staining in L5 DRGs 3 wk after injection of AAV5-YFP (C), AAV5-CCL2 with inset image taken at 63× (D), AAV5-CCL2 in CCR2 −/− mice (E), or 7 d after SNI in WT mice (F). Quantification of pSTAT3 staining represented as the percentage of the imaged area positively immuno-labeled (G). Representative images of ATF3 staining in L5 DRGs 3 wk after injection of AAV5-YFP (H), AAV5-CCL2 (I), AAV5-CCL2 in CCR2 −/− mice (J), or 7 d after SNI in WT mice (K). Quantification of ATF3 staining (L). Representative images of SPRR1a staining in L5 DRGs 3 wk after injection of AAV5-YFP (M), AAV5-CCL2 (N), AAV5-CCL2 in CCR2 −/− mice (O), or 7 d after SNI in WT mice (P). Quantification of SPRR1a staining (Q).For RT-PCR: *p < 0.05. **p < 0.001. n=5 per group. For IHC: Scale bar=100 μm. n=8 per group. *p < 0.05. **p < 0.001.
Fig. 7
Fig. 7. pSTAT3 is required for the CCL2 overexpression-induced increase in neurite outgrowth
Quantification of neurite outgrowth in DRG dissociated cell culture in the presence of inhibitors of STAT3 phosphorylation, AG490 (50 nM) or STATTIC (10 nM), or vehicle control, measured after 24 h, 3 wk after intrathecal injection of AAV5-CCL2 or AAV5-YFP (A). Quantification of pSTAT3 nuclear pixel intensity in dissociated cell culture in the presence of the STAT3 phosphorylation inhibitors, AG490 or STATTIC, or vehicle control, measured after 24 h, 3 wk after intrathecal injection of AAV5-CCL2 or AAV5-YFP (B). Representative images of neurite outgrowth and pSTAT3 are shown for AAV5-YFP Vehicle (C–E), AAV5-CCL2 Vehicle (F–H), AAV5-YFP AG490 (I–K), AAV5-CCL2 AG490 (L–N), AAV5-YFP STATTIC (O-Q), and AAV5-CCL2 STATTIC (R–T). Insets are digitally magnifications of the neuronal cell body. Scale bar =100 μm. For neurite outgrowth: n=51–99 neurons per group. **p < 0.001. For pixel intensity: n=51–99 neurons per group. *p < 0.05.

Similar articles

Cited by

References

    1. Abbadie C, Bhangoo S, De Koninck Y, Malcangio M, Melik-Parsadaniantz S, White FA. Chemokines and pain mechanisms. Brain Res Rev. 2009;60:125–134. - PMC - PubMed
    1. Alan R, Ezekowitz B, Gordon S. Alterations of surface properties by macrophage activation: expression of receptors for Fc and mannose-terminal glycoproteins and differentiation antigens, Macrophage Activation. Springer. 1984:33–56. - PubMed
    1. Baldwin KT, Carbajal KS, Segal BM, Giger RJ. Neuroinflammation triggered by β-glucan/dectin-1 signaling enables CNS axon regeneration. Proc Natl Acd Sci USA. 2015;112:2581–2586. - PMC - PubMed
    1. Banner LR, Patterson PH. Major changes in the expression of the mRNAs for cholinergic differentiation factor/leukemia inhibitory factor and its receptor after injury to adult peripheral nerves and ganglia. Proc Natl Acad Sci USA. 1994;91:7109–7113. - PMC - PubMed
    1. Bareyre FM, Garzorz N, Lang C, Misgeld T, Buning H, Kerschensteiner M. In vivo imaging reveals a phase-specific role of STAT3 during central and peripheral nervous system axon regeneration. Proc Natl Acd Sci USA. 2011;108:6282–6287. - PMC - PubMed

Publication types