iBet uBet web content aggregator. Adding the entire web to your favor.


Link to original content: https://pubmed.ncbi.nlm.nih.gov/25999599
The War on Poverty's Experiment in Public Medicine: Community Health Centers and the Mortality of Older Americans - PubMed Skip to main page content
U.S. flag

An official website of the United States government

Dot gov

The .gov means it’s official.
Federal government websites often end in .gov or .mil. Before sharing sensitive information, make sure you’re on a federal government site.

Https

The site is secure.
The https:// ensures that you are connecting to the official website and that any information you provide is encrypted and transmitted securely.

Access keys NCBI Homepage MyNCBI Homepage Main Content Main Navigation
. 2015 Mar;105(3):1067-1104.
doi: 10.1257/aer.20120070.

The War on Poverty's Experiment in Public Medicine: Community Health Centers and the Mortality of Older Americans

Affiliations

The War on Poverty's Experiment in Public Medicine: Community Health Centers and the Mortality of Older Americans

Martha J Bailey et al. Am Econ Rev. 2015 Mar.

Abstract

This paper uses the rollout of the first Community Health Centers (CHCs) to study the longer-term health effects of increasing access to primary care. Within ten years, CHCs are associated with a reduction in age-adjusted mortality rates of 2 percent among those 50 and older. The implied 7 to 13 percent decrease in one-year mortality risk among beneficiaries amounts to 20 to 40 percent of the 1966 poor/non-poor mortality gap for this age group. Large effects for those 65 and older suggest that increased access to primary care has longer-term benefits, even for populations with near universal health insurance. (JEL H75, I12, I13, I18, I32, I38, J14).


Figures

Figure 1
Figure 1
Community Health Center Funding, 1965–2000 Notes: Federal expenditure data are expenditures for the Neighborhood or Community Health Center program. Differences between federal expenditures and state grants received may be due to double-counting of centers or funding spread over multiple years that is reported in one year only. Sources: Information on OEO grants comes from the NACAP and NAFO files. Federal expenditures data are taken from line-items in the Budget of the United States Government and US Department of Health, Education, and Welfare.
Figure 2
Figure 2
All-Cause Mortality Rates by Age Group, 1959–1988 Sources: Vital Statistics Multiple-Cause of Death Files (US DHHS 2007), 1950 and 1960 population estimates (Haines and ICPSR 2005), and 1969 to 1988 population statistics (SEER 2009).
Figure 3
Figure 3
Establishment of Community Health Centers by County of Service Delivery, 1965–1980 Note: Dates are the first year that a CHC was established in the county. Source: Information on CHCs drawn from NACAP and PHS reports.
Figure 4
Figure 4
Relationships between Community Health Center Initiation and Mortality Rates Notes: AMR = Age adjusted mortality rate. The dependent variable refers to levels of our changes in age-adjusted mortality over all ages. Univariate fitted values are from regressions of the dependent variable on the year CHCs were established for the 114 treated counties in the estimation sample. The estimated univariate slopes are −6.9 (SE = 6.1) for panel A, and 0.2 (SE = 1.4) for panel B. Multivariate regressions follow Almond et al. (2011) and include the 1960 share of the county population that is urban, rural, between ages 0 and 4, older than 64, nonwhite, has more than 12 years of education, has less than 4 years of education, has family income less than $3,000, has family income more than $10,000; and the per capita number of physicians (see Table 1). The estimated multivariate slopes are 2.9 (SE = 2.7) for panel A and 2.3 (SE = 1.7) for panel B. Source: See Figures 1 and 2.
Figure 5
Figure 5
The Relationship between Community Health Centers and Mortality Rates Notes: The dependent variable is the age-adjusted mortality rate (AMR) per 100,000 residents. The coefficients are weighted least-squares estimates of π and τ from our baseline specification of equation (1). Dashed lines are 9 percent confidence intervals for the models using the early CHCs (1965–1974) on the county sample observed 1959–1988 and are based on standard errors corrected for an arbitrary covariance structure at the county level. Weights are the total county populations in 1960. See text for further model details. The year prior to the establishment of the CHC is omitted because CHCs were funded for the entirety of years 1–14 but only for part of year 0. Samples: 1959–1988: 3,044 US counties with valid data on 1960 characteristics (91,320 county-year observations). 1959–1988: 388 US counties that are identified in each year of vital statistics data (15,520 county-year observations). Sources: Mortality rates constructed from the 1959–1988 Vital Statistics Multiple-cause of Death Files (US DHHS 2007), 1950 and 1960 population estimates (Haines and ICPSR 2005), and 1969–1988 population statistics (SEER 2009). Information on CHCs is drawn from NACAP and PHS reports.
Figure 6
Figure 6
Heterogeneity in the Relationship between Community Health Centers and Mortality Rates by Population Density Notes: The coefficients are weighted, least-squares estimates of π and τ from our baseline specification of equation (1) where the event-study dummies are estimated separately for areas with above (labeled “urban”) and below (labeled “non-urban”) the median 1960 urban share of the population among treated counties. See Figure 5 notes for details on the specification and sources.
Figure 7
Figure 7
The Relationship between Community Health Centers and Age-Group Mortality Rates Notes: The dependent variable is the all-cause, age-adjusted mortality rate for the indicated age group. Infant mortality is measured per 1,000 live births and mortality rates for other groups are measured per 100,000 residents. Weights are the appropriate county populations in 1960. Infant sample: 2,982 counties with valid data on 1960 characteristics identified in both mortality and natality files (89,460 county-year observations). Mean of infant mortality rate in treated counties in t − 1: 21.4 deaths per 1,000 live births. Non-infant sample: 3,044 US counties with valid data on 1960 characteristics (91,320 county-year observations). Mean of AMR in treated counties in t − 1 for children is 64; for adults is 291; and for older adults is 3,213 (deaths per 100,000). See notes to Figure 5 for details.
Figure 8
Figure 8
Relationship between Community Health Centers and Medicare Utilization Notes: The figure plots weighted least-squares estimates of π and τ from our baseline specification of equation (1). The dependent variable in panel A is real ($2012) Medicare spending per enrollee and in panel B it is the Medicare enrollment rates in parts A and B (enrollees divided by county population 65 and older). In treated counties in the year before CHC establishment, the sample means are 0.97 and 0.93 for enrollment in parts A and B, $1,089.83 for per-enrollee spending on part A, and $429.22 for B. 1973 is missing and is linearly interpolated. Data from July 1966 through December 1967 is allocated to calendar years 1966 and 1967 in proportion to the number of months (1/3 and 2/3). Sources: County level Medicare (US SSA 1969–1977; US HFA 1978–1980) and the Area Resource File (US DHHS 1994). Data on Medicare and military medical expenditures (panel A) were shared by Almond, Hoynes, and Schanzenbach (2011)
Figure 9
Figure 9
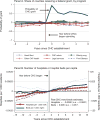
The Relationship between Community Health Centers, Other Federal Program Grants, and Hospital Capacity Notes: The figure plots weighted least-squares estimates of π and τ from our baseline specification of equation (1). In panel A, the dependent variable is equal to 1 if the county received any federal grant for the indicated program in a given year. In the case of Food Stamps, the dependent variable is equal to 1 at the date of implementation. In panel B, the dependent variables are hospitals per thousand residents (left vertical axis) and beds per thousand residents (right vertical axis). The sample excludes mental institutions, tuberculosis sanatoriums, military hospitals, and correctional hospitals. The sample means are 0.025 for hospitals per capita and 6.18 for beds per capita in treated counties in the year before CHC establishment. We omit REIS variables from panel B specifications (because they are not measured before 1959) and the AHA variables (because they are the key left-hand side variables). Data for 1954, 1977, and 1979 are missing and linearly interpolated. Trend-break estimates come from a model which contains an event-time variable, an interaction between event-time and post-treatment, and a dummy for post-treatment. See Figure 5 notes for details on the specification and sample. Sources: NACAP, NAFO, PHS reports (see online Appendix A); Almond, Hoynes, and Schanzenbach (2011) for the Food Stamp data, 1948 to 1975 AHA Surveys (provided by Amy Finkelstein), and the 1972 to 1990 AHA Surveys (provided by the NBER).

Similar articles

Cited by

References

    1. Adashi Eli, Geiger H Jack, Fine Michael D. Health Care Reform and Primary Care—The Growing Importance of the Community Health Center. New England Journal of Medicine. 2010;362(22):2047–50. - PubMed
    1. Almond Douglas, Chay Kenneth, Greenstone Michael. MIT Department of Economics Working Paper 07-04. 2006. Civil Rights, the War on Poverty, and Black-White Convergence in Infant Mortality in the Rural South and Mississippi.
    1. Almond Douglas, Hoynes Hilary W, Schanzenbach Diane Whitmore. Inside the War on Poverty: The Impact of Food Stamps on Birth Outcomes. Review of Economics and Statistics. 2011;93(2):387–403.
    1. American Hospital Association (AHA) Annual Survey of Hospitals. Chicago: AHA; 1948–1990.
    1. Arellano M. Computing Robust Standard Errors for Within-Groups Estimators. Oxford Bulletin of Economics and Statistics. 1987;49(4):431–34.

LinkOut - more resources