Nonlinear Image Representation Using Divisive Normalization
- PMID: 25346590
- PMCID: PMC4207373
- DOI: 10.1109/CVPR.2008.4587821
Nonlinear Image Representation Using Divisive Normalization
Abstract
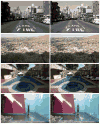
In this paper, we describe a nonlinear image representation based on divisive normalization that is designed to match the statistical properties of photographic images, as well as the perceptual sensitivity of biological visual systems. We decompose an image using a multi-scale oriented representation, and use Student's t as a model of the dependencies within local clusters of coefficients. We then show that normalization of each coefficient by the square root of a linear combination of the amplitudes of the coefficients in the cluster reduces statistical dependencies. We further show that the resulting divisive normalization transform is invertible and provide an efficient iterative inversion algorithm. Finally, we probe the statistical and perceptual advantages of this image representation by examining its robustness to added noise, and using it to enhance image contrast.
Figures


Similar articles
-
Nonlinear image representation for efficient perceptual coding.IEEE Trans Image Process. 2006 Jan;15(1):68-80. doi: 10.1109/tip.2005.860325. IEEE Trans Image Process. 2006. PMID: 16435537
-
Divisively Normalized Sparse Coding: Toward Perceptual Visual Signal Representation.IEEE Trans Cybern. 2021 Aug;51(8):4237-4250. doi: 10.1109/TCYB.2019.2899005. Epub 2021 Aug 4. IEEE Trans Cybern. 2021. PMID: 30843814
-
Visual information flow in Wilson-Cowan networks.J Neurophysiol. 2020 Jun 1;123(6):2249-2268. doi: 10.1152/jn.00487.2019. Epub 2020 Mar 11. J Neurophysiol. 2020. PMID: 32159407
-
The divisive normalization model of V1 neurons: a comprehensive comparison of physiological data and model predictions.J Neurophysiol. 2017 Dec 1;118(6):3051-3091. doi: 10.1152/jn.00821.2016. Epub 2017 Aug 23. J Neurophysiol. 2017. PMID: 28835531 Free PMC article. Review.
-
[Incident Photon Number and Reconstructed Linear Attenuation Coefficients in Iterative CT Image Reconstruction].Igaku Butsuri. 2019;38(4):143-158. doi: 10.11323/jjmp.38.4_143. Igaku Butsuri. 2019. PMID: 30828046 Review. Japanese.
Cited by
-
Teaching deep networks to see shape: Lessons from a simplified visual world.PLoS Comput Biol. 2024 Nov 11;20(11):e1012019. doi: 10.1371/journal.pcbi.1012019. eCollection 2024 Nov. PLoS Comput Biol. 2024. PMID: 39527647 Free PMC article.
-
Biological Basis and Computer Vision Applications of Image Phase Congruency: A Comprehensive Survey.Biomimetics (Basel). 2024 Jul 10;9(7):422. doi: 10.3390/biomimetics9070422. Biomimetics (Basel). 2024. PMID: 39056863 Free PMC article. Review.
-
Attention-Aware Patch-Based CNN for Blind 360-Degree Image Quality Assessment.Sensors (Basel). 2023 Oct 24;23(21):8676. doi: 10.3390/s23218676. Sensors (Basel). 2023. PMID: 37960376 Free PMC article.
-
Divisive normalization processors in the early visual system of the Drosophila brain.Biol Cybern. 2023 Dec;117(6):411-431. doi: 10.1007/s00422-023-00972-x. Epub 2023 Sep 13. Biol Cybern. 2023. PMID: 37702831 Free PMC article.
-
Artifact- and content-specific quality assessment for MRI with image rulers.Med Image Anal. 2022 Apr;77:102344. doi: 10.1016/j.media.2021.102344. Epub 2022 Jan 20. Med Image Anal. 2022. PMID: 35091278 Free PMC article.
References
-
- Andrews DF, Mallows CL. Scale mixtures of normal distributions. Journal of the Royal Statistical Society, Series B. 1974;36(1):99–102.
-
- Bethge M. Factorial coding of natural images: How effective are linear models in removing higher-order dependencies? J Opt Soc Am A. 2006 Jun;23(6):1253–1268. - PubMed
-
- Bonnier N, Simoncelli EP. Locally adaptive multiscale contrast optimization. Proc 12th IEEE Int’l Conf on Image Proc; Genoa, Italy. September 11–14 2005; pp. 949–952.
-
- Buccigrossi RW, Simoncelli EP. Image compression via joint statistical characterization in the wavelet domain. 1999;8(12):1688–1701. - PubMed
-
- Burt PJ. Fast filter transforms for image processing. Comp Graph Image Proc. 1981;16:20–51.
Grants and funding
LinkOut - more resources
Full Text Sources
Other Literature Sources

