iBet uBet web content aggregator. Adding the entire web to your favor.


Link to original content: https://pubmed.ncbi.nlm.nih.gov/24913235/
Sphingosine-1-phosphate receptor 2 is critical for follicular helper T cell retention in germinal centers - PubMed Skip to main page content
U.S. flag

An official website of the United States government

Dot gov

The .gov means it’s official.
Federal government websites often end in .gov or .mil. Before sharing sensitive information, make sure you’re on a federal government site.

Https

The site is secure.
The https:// ensures that you are connecting to the official website and that any information you provide is encrypted and transmitted securely.

Access keys NCBI Homepage MyNCBI Homepage Main Content Main Navigation
. 2014 Jun 30;211(7):1297-305.
doi: 10.1084/jem.20131666. Epub 2014 Jun 9.

Sphingosine-1-phosphate receptor 2 is critical for follicular helper T cell retention in germinal centers

Affiliations

Sphingosine-1-phosphate receptor 2 is critical for follicular helper T cell retention in germinal centers

Saya Moriyama et al. J Exp Med. .

Abstract

Follicular helper T (Tfh) cells access the B cell follicle to promote antibody responses and are particularly important for germinal center (GC) reactions. However, the molecular mechanisms of how Tfh cells are physically associated with GCs are incompletely understood. We report that the sphingosine-1-phosphate receptor 2 (S1PR2) gene is highly expressed in a subpopulation of Tfh cells that localizes in GCs. S1PR2-deficient Tfh cells exhibited reduced accumulation in GCs due to their impaired retention. T cells deficient in both S1PR2 and CXCR5 were ineffective in supporting GC responses compared with T cells deficient only in CXCR5. These results suggest that S1PR2 and CXCR5 cooperatively regulate localization of Tfh cells in GCs to support GC responses.


Figures

Figure 1.
Figure 1.
Functional expression of S1PR2 and magnitudes of S1pr2 expression in CXCR5hiPD-1hi Tfh cells. (A) In vitro chemotaxis assay of CD4+ T cells. Splenocytes from mice 10–12 d after sheep red blood cell immunization were cultured in transwell plates and analyzed by flow cytometry. Chemotaxis of CXCR5hiPD-1hi and CXCR5 CD4+ T cells was measured toward CXCL13 or CXCL12 with or without S1P and/or JTE-013. Data are pooled from three independent experiments and presented as mean ± SEM. n = 8–10. *, P < 0.05; **, P < 0.01; ***, P < 0.001; ****, P < 0.0001 (one-way ANOVA with Bonferroni’s post-test). (B) Flow cytometric analysis of Venus expression on B cells (left) and CD4+ T cells (right) from PPs of S1pr2V/+ mice. The gray filled histograms depict B cells or CD4+ T cells from S1pr2+/+ mice. Data are representative of at least two independent experiments. (C) Developmental time course of Tfh cells and Venushi Tfh cells. S1pr2V/+ OT-II T cells and Hy10 B cells (2 × 10⁵ each per head) were cotransferred into recipient mice which were then immunized with HEL-OVA in CFA, and analyzed by flow cytometry on each time point. Total numbers of indicated donor cells in a draining LN are shown. Data are representative of two independent experiments, and presented as mean ± SEM. n = 3–7. (D) Flow cytometry data of PP CD4+ T cells from Foxp3hCD2 S1pr2V/+ mice. Venus expression on indicated T cell subsets are shown. Data are representative of two independent experiments with five mice in total.
Figure 2.
Figure 2.
S1pr2-high Tfh cells are localized in the GC in an S1PR2-dependent manner. (A–C) OT-II T cells of the indicated genotypes were transferred to congenic recipient mice that were subsequently immunized with OVA in alum. Draining LNs were analyzed 7 d after immunization. Data are pooled from four (A and B) or three (C) independent experiments with 5–7 mice of each type in total. (A) Representative sections stained with anti-GFP antibody to detect Venus, for CD45.2 to identify OT-II T cells, and for IgD to demarcate GCs. OT-II T cells with clearly detectable levels of Venus expression are pointed with arrowheads. Bars, 100 µm. (B) Enumeration of the percentages of OT-II T cells in the GCs out of total OT-II T cells in the follicles. Data are normalized by the area of GCs and follicles, which was not significantly different between three groups, and presented as mean ± SEM of 9 (S1pr2+/+), 7 (S1pr2V/+), and 11 (S1pr2V/V) different follicles. *, P < 0.05; **, P < 0.01 (one-way ANOVA with Bonferroni’s post-test). (C) Flow cytometric enumeration of the percentages of Tfh cells in total OT-II T cell population. Data are presented as mean ± SEM. (D) Flow cytometry of Bcl6, ICOS, and Il21 expression in Tfh cells of draining LN cells from mice of the indicated genotypes on 9 d after immunization. For Il21 detection, mice were crossed with IL-21/hCD2 BAC transgenic mice. Gray- and green-filled histograms show the data of WT CD44lo CD4+ T cells and WT Tfh cells, respectively. The left panel shows gating strategy for Tfh cells. Data are representative of two independent experiments with 3 (Bcl6 and ICOS) or 2 (Il21) mice of each genotype.
Figure 3.
Figure 3.
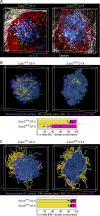
S1PR2 is important for Tfh cell retention in the GC. (A) Representative two-photon images of GCs. GFP+ S1pr2+/+ or GFP+ S1pr2V/V OT-II T cells (2 × 10⁴ cells per head), S1pr2+/+ OT-II T cells (2 × 10⁵ cells per head), and CFP+ Hy10 B cells (2 × 10⁵ cells per head) were transferred to recipient mice. Explanted LNs were observed 7 or 8 d after s.c. immunization with HEL-OVA in alum. 1–3 d before imaging, 1.4–3.0 × 10⁷ rhodamine-labeled polyclonal B cells were transferred for demarcation of the follicular regions. See also Videos 1 and 2. The images are 84 µm (left) and 96 µm (right) z-projections. Data are representative of two independent experiments with 8 (S1pr2+/+) and 5 (S1pr2V/V) recipient mice in total. (B) Cell tracking analysis of OT-II T cells that access the interface zone from the GC. GC surfaces were reconstructed from the CFP images in A. The tracks show migration paths of OT-II T cells that entered the interface zone from the GC and then left the interface zone to the GC (yellow) or FM (pink). The color brightness of the tracks is reduced on the parts submerged under the GC surfaces. The horizontal histogram shows the ratios of yellow tracks to pink tracks. Dots represent individual LNs used for the imaging analysis. 6–79 cells were tracked per LN. **, P < 0.01 (Student’s t test). (C) Cell tracking analysis data of OT-II T cells that access the interface zone from the FM. The tracks show migration paths of OT-II T cells that entered the interface zone from the FM and then left the interface zone to the FM (yellow) or GC (pink). The graph shows the ratios of yellow tracks to pink tracks. 12–98 cells were tracked per LN. Bars, 50 µm. Data are pooled from two independent experiments with 8 (S1pr2+/+) and 4 (S1pr2V/V) mice in total (B and C).
Figure 4.
Figure 4.
mRNA expression profiles of Tfh cells with different levels of S1pr2 expression. (A) mRNA expression profiles of Venushi Tfh, Venuslo Tfh, PD-1int Th, PD-1lo Th, and naive CD4+ T cells are shown as heat map. See Fig. S3 A for the details of cell sorting. Each column represents a single experiment pooled from 3 to 8 (Venushi Tfh, Venuslo Tfh, PD-1int Th, PD-1lo Th) or 1 to 2 (naive CD4+ T) mice. (B and C) The cytokine reporter (hCD2)–expressing cell percentages in Venuslo or Venushi Tfh cells of S1pr2V/+Il4-reporter mice (B) and S1pr2V/+Il21-reporter mice (C). Draining LN cells were analyzed 9 or 11 d after immunization with CGG in CFA s.c. Data are pooled from two independent experiments with 8 LNs from 2 mice (B) or 7 LNs from 2 mice (C). Horizontal bars represent mean values. ***, P < 0.001; ****, P < 0.0001 (Student’s t test).
Figure 5.
Figure 5.
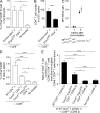
S1PR2 and CXCR5 expression in Tfh cells are required for supporting GC responses. (A and B) S1pr2+/+ or S1pr2V/+ (control), or S1pr2V/V CD4+ T cells were transferred to CD28−/− mice, and mice were immunized with NP-CGG in alum or CFA and analyzed 2 wk after immunization. Data are pooled from three independent experiments. (A) Flow cytometric enumeration of the percentages of GC cells in lymphocytes. n = 6 (control), 6 (S1pr2V/V), and 4 (no transfer control). Data are presented as mean ± SEM. (B) Enumeration of CD4+ T cell number in GC sections. 22 GCs from 5 mice (control) and 24 GCs from 5 mice (S1pr2V/V) were analyzed. Data are presented as mean ± SEM. (C) ELISA data of sera collected from mixed BM chimeras of indicated genotypes. Sublethally irradiated Rag1-deficient mice were reconstituted with S1pr2+/+ μMT BM cells or S1pr2V/V μMT BM cells mixed with Tcrα−/− BM cells, and immunized i.p. with NP-CGG in alum. Ratios of anti-NP1 IgG1 concentration to anti-NP24 IgG1 concentration are shown. Data are representative of three independent experiments, and are presented as mean ± SEM. n = 4 (S1pr2+/+ μMT) and 4 (S1pr2V/V μMT). (D) CD4+ T cells of the indicated genotypes were transferred to Cd28−/− mice. On the next day, the mice were immunized i.p. with NP-OVA in alum, and GC B cell frequencies were analyzed 3 wk after immunization by flow cytometry. Data are pooled from three independent experiments, and are presented as mean ± SEM. n = 6 (Cxcr5−/−), 7 (Cxcr5−/− S1pr2V/V), 5 (WT), and 3 (no transfer control). (E) CD4+ T cells were mixed in 1: 1 ratio, and transferred to Cd28−/− mice. On the next day, the mice were immunized i.p. with NP-OVA in alum, and analyzed 3 wk after immunization. Data are representative of two experiments, and are presented as mean ± SEM. Shown is the number of CD45.2 CD4+ T cells in GC sections normalized by the number of CD45.1 CD4+ T cells in GC sections. 9 different GCs from 2 mice were analyzed for each donor type. *, P < 0.05; **, P < 0.01; ***, P < 0.001; ****, P < 0.0001 (A, B, D, and E). One-way ANOVA with Bonferroni’s post-test (A, D, and E) and Student’s t test (B) were used for statistical analysis.

Similar articles

Cited by

References

    1. Allen C.D., Okada T., Tang H.L., Cyster J.G. 2007. Imaging of germinal center selection events during affinity maturation. Science. 315:528–531 10.1126/science.1136736 - DOI - PubMed
    1. Ansel K.M., McHeyzer-Williams L.J., Ngo V.N., McHeyzer-Williams M.G., Cyster J.G. 1999. In vivo–activated CD4 T cells upregulate CXC chemokine receptor 5 and reprogram their response to lymphoid chemokines. J. Exp. Med. 190:1123–1134 10.1084/jem.190.8.1123 - DOI - PMC - PubMed
    1. Arnold C.N., Campbell D.J., Lipp M., Butcher E.C. 2007. The germinal center response is impaired in the absence of T cell-expressed CXCR5. Eur. J. Immunol. 37:100–109 10.1002/eji.200636486 - DOI - PubMed
    1. Cattoretti G., Mandelbaum J., Lee N., Chaves A.H., Mahler A.M., Chadburn A., Dalla-Favera R., Pasqualucci L., MacLennan A.J. 2009. Targeted disruption of the S1P2 sphingosine 1-phosphate receptor gene leads to diffuse large B-cell lymphoma formation. Cancer Res. 69:8686–8692 10.1158/0008-5472.CAN-09-1110 - DOI - PMC - PubMed
    1. Du W., Takuwa N., Yoshioka K., Okamoto Y., Gonda K., Sugihara K., Fukamizu A., Asano M., Takuwa Y. 2010. S1P2, the G protein-coupled receptor for sphingosine-1-phosphate, negatively regulates tumor angiogenesis and tumor growth in vivo in mice. Cancer Res. 70:772–781 10.1158/0008-5472.CAN-09-2722 - DOI - PubMed

Publication types

MeSH terms

Substances

Associated data