Diffeomorphometry and geodesic positioning systems for human anatomy
- PMID: 24904924
- PMCID: PMC4041578
- DOI: 10.1142/S2339547814500010
Diffeomorphometry and geodesic positioning systems for human anatomy
Abstract
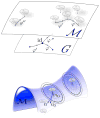
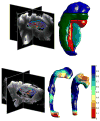
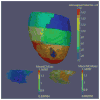
The Computational Anatomy project has largely been a study of large deformations within a Riemannian framework as an efficient point of view for generating metrics between anatomical configurations. This approach turns D'Arcy Thompson's comparative morphology of human biological shape and form into a metrizable space. Since the metric is constructed based on the geodesic length of the flows of diffeomorphisms connecting the forms, we call it diffeomorphometry. Just as importantly, since the flows describe algebraic group action on anatomical submanifolds and associated functional measurements, they become the basis for positioning information, which we term geodesic positioning. As well the geodesic connections provide Riemannian coordinates for locating forms in the anatomical orbit, which we call geodesic coordinates. These three components taken together - the metric, geodesic positioning of information, and geodesic coordinates - we term the geodesic positioning system. We illustrate via several examples in human and biological coordinate systems and machine learning of the statistical representation of shape and form.
Figures

 (m0,n) = ||v0||V.


Similar articles
-
Hamiltonian Systems and Optimal Control in Computational Anatomy: 100 Years Since D'Arcy Thompson.Annu Rev Biomed Eng. 2015;17:447-509. doi: 10.1146/annurev-bioeng-071114-040601. Epub 2015 Nov 4. Annu Rev Biomed Eng. 2015. PMID: 26643025 Review.
-
Computational anatomy and diffeomorphometry: A dynamical systems model of neuroanatomy in the soft condensed matter continuum.Wiley Interdiscip Rev Syst Biol Med. 2018 Nov;10(6):e1425. doi: 10.1002/wsbm.1425. Epub 2018 Jun 4. Wiley Interdiscip Rev Syst Biol Med. 2018. PMID: 29862670 Free PMC article. Review.
-
Locally Linear Diffeomorphic Metric Embedding (LLDME) for surface-based anatomical shape modeling.Neuroimage. 2011 May 1;56(1):149-61. doi: 10.1016/j.neuroimage.2011.01.069. Epub 2011 Jan 31. Neuroimage. 2011. PMID: 21281721
-
Geodesic Shooting for Computational Anatomy.J Math Imaging Vis. 2006 Jan 31;24(2):209-228. doi: 10.1007/s10851-005-3624-0. J Math Imaging Vis. 2006. PMID: 20613972 Free PMC article.
-
A Computational Model of Multidimensional Shape.Int J Comput Vis. 2010 Aug 1;89(1):69-83. doi: 10.1007/s11263-010-0323-0. Int J Comput Vis. 2010. PMID: 21057668 Free PMC article.
Cited by
-
Cross-modality mapping using image varifolds to align tissue-scale atlases to molecular-scale measures with application to 2D brain sections.Nat Commun. 2024 Apr 25;15(1):3530. doi: 10.1038/s41467-024-47883-4. Nat Commun. 2024. PMID: 38664422 Free PMC article.
-
Projective Diffeomorphic Mapping of Molecular Digital Pathology with Tissue MRI.Commun Eng. 2022;1:44. doi: 10.1038/s44172-022-00044-1. Epub 2022 Dec 13. Commun Eng. 2022. PMID: 37284027 Free PMC article.
-
Incomplete spectrum QSM using support information.Front Neurosci. 2023 Apr 17;17:1130524. doi: 10.3389/fnins.2023.1130524. eCollection 2023. Front Neurosci. 2023. PMID: 37139523 Free PMC article.
-
Spatiotemporal Cardiac Statistical Shape Modeling: A Data-Driven Approach.Stat Atlases Comput Models Heart. 2022 Sep;13593:143-156. doi: 10.1007/978-3-031-23443-9_14. Epub 2023 Jan 28. Stat Atlases Comput Models Heart. 2022. PMID: 37103466 Free PMC article.
-
Learning spatiotemporal statistical shape models for non-linear dynamic anatomies.Front Bioeng Biotechnol. 2023 Jan 27;11:1086234. doi: 10.3389/fbioe.2023.1086234. eCollection 2023. Front Bioeng Biotechnol. 2023. PMID: 36777257 Free PMC article.
References
-
- Younes L. Shapes and diffeomorphisms. Shapes and Diffeomorphisms. 2010;171:1–434.
-
- Christensen GE, Rabbitt RD, Miller MI. Deformable templates using large deformation kinematics. IEEE Trans Image Process. 1996;5:1435–1447. - PubMed
-
- Trouve A. Action de groupe de dimension intinie et reconnaissance de formes. C R Acad Sci Paris Ser 1 Math. 1995;321:1031–1034.
-
- Dupuis P, Grenander U, Miller MI. Variational problems on flows of diffeomorphisms for image matching. Quart Appl Math. 1998;56:587–600.
-
- Avants BB, Schoenemann PT, Gee JC. Lagrangian frame diffeomorphic image registration: Morphometric comparison of human and chimpanzee cortex. Med Image Anal. 2006;10:397–412. - PubMed
Grants and funding
- R01 MH056584/MH/NIMH NIH HHS/United States
- R01 EB003543/EB/NIBIB NIH HHS/United States
- S10 RR025053/RR/NCRR NIH HHS/United States
- R01 EB008171/EB/NIBIB NIH HHS/United States
- R01 NS084957/NS/NINDS NIH HHS/United States
- R24 HL085343/HL/NHLBI NIH HHS/United States
- R01 EB000975/EB/NIBIB NIH HHS/United States
- P41 RR015241/RR/NCRR NIH HHS/United States
- R01 MH084803/MH/NIMH NIH HHS/United States
- U01 AG033655/AG/NIA NIH HHS/United States
- R01 EB001838/EB/NIBIB NIH HHS/United States
- P50 MH071616/MH/NIMH NIH HHS/United States
- U01 NS082085/NS/NINDS NIH HHS/United States
- P41 EB015909/EB/NIBIB NIH HHS/United States
LinkOut - more resources
Full Text Sources
Other Literature Sources
Research Materials
Miscellaneous

