iBet uBet web content aggregator. Adding the entire web to your favor.


Link to original content: https://pubmed.ncbi.nlm.nih.gov/24755649
The rainbow trout genome provides novel insights into evolution after whole-genome duplication in vertebrates - PubMed Skip to main page content
U.S. flag

An official website of the United States government

Dot gov

The .gov means it’s official.
Federal government websites often end in .gov or .mil. Before sharing sensitive information, make sure you’re on a federal government site.

Https

The site is secure.
The https:// ensures that you are connecting to the official website and that any information you provide is encrypted and transmitted securely.

Access keys NCBI Homepage MyNCBI Homepage Main Content Main Navigation
. 2014 Apr 22:5:3657.
doi: 10.1038/ncomms4657.

The rainbow trout genome provides novel insights into evolution after whole-genome duplication in vertebrates

Affiliations
Free PMC article

The rainbow trout genome provides novel insights into evolution after whole-genome duplication in vertebrates

Camille Berthelot et al. Nat Commun. .
Free PMC article

Abstract

Vertebrate evolution has been shaped by several rounds of whole-genome duplications (WGDs) that are often suggested to be associated with adaptive radiations and evolutionary innovations. Due to an additional round of WGD, the rainbow trout genome offers a unique opportunity to investigate the early evolutionary fate of a duplicated vertebrate genome. Here we show that after 100 million years of evolution the two ancestral subgenomes have remained extremely collinear, despite the loss of half of the duplicated protein-coding genes, mostly through pseudogenization. In striking contrast is the fate of miRNA genes that have almost all been retained as duplicated copies. The slow and stepwise rediploidization process characterized here challenges the current hypothesis that WGD is followed by massive and rapid genomic reorganizations and gene deletions.


Figures

Figure 1
Figure 1. Evolutionary position of the rainbow trout.
This tree is based on the time-calibrated phylogeny information from Near et al. except for the additional branches in red. The red stars show the position of the teleost-specific (Ts3R) and the salmonid-specific (Ss4R) whole-genome duplications. Groups of species in which a genome sequence is available are shown in red bold type, with one example in each group. Origin of fish pictures: Manfred Schartl and Christoph Winkler (medaka, zebrafish and Tetraodon), John F. Scarola (rainbow trout), Bernd Ueberschaer (Nile tilapia) and Konrad Schmidt (three-spined stickleback).
Figure 2
Figure 2. Evolutionary history of the duplicated trout genome.
(a) Double-conserved synteny between the trout and medaka genomes. Each medaka chromosome (represented as a horizontal black line) is mostly syntenic with two different chromosomes in the trout genome (syntenic trout regions represented on either side by different colours according to their chromosomal location), a pattern typically associated with whole-genome duplication. Pairs of paralogous trout genes that are inserted in a double-conserved synteny block compared to a non-salmonid fish genome are consistent with an origin at the Ss4R event (ohnologues), while genes that are inserted in a double-conserved synteny block but have no paralogue are singletons that have lost their duplicate copy since the Ss4R event. Only genes anchored to a trout chromosome are represented. (b) Successive rounds of duplication in the trout genome. The double-conserved synteny pattern between trout and non-salmonid fish delineates large chromosomal regions in the trout genome that are Ss4R duplicates of each other (outer circle, joined by grey links), descended from the same ancestral region. These ancestral pre-duplication regions could be grouped into 31 ancestral chromosomes (inner circle) based on the organization of their orthologous counterparts in non-salmonid genomes. The ancestral pre-duplication karyotype itself is an ancient tetraploid following the Ts3R event: Ts3R-duplicated regions in the pre-duplication karyotype are highlighted by grey links within the inner circle. On the right is detailed the evolutionary history of one ancestral genomic region that gave rise to paralogous regions in chromosomes 6/11 and 5/12/Sex through the Ts3R and Ss4R successive WGD events. (c) Chromosomal organization of the modern rainbow trout genome. Colours as in (b); duplicated regions are joined by grey links. Most modern trout chromosomes result from a fusion between two Ss4R-duplicated blocks descending from different ancestral chromosomes. The order of the duplicated blocks within each modern chromosome does not necessarily reflect the actual organization of the chromosome, as gene orders may have been reshuffled by intra-chromosomal rearrangements (see (d)). (d) Modern organization of the Ss4R-duplicated regions in the trout genome. Colours are as in (b,c).
Figure 3
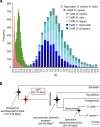
Figure 3. Timing of the salmonid-specific 4th round of genome duplication (Ss4R).
(a) Frequency distribution of dS values for pairs of genes in fish genomes. The distribution of dS values between Atlantic salmon and rainbow trout orthologues (pink; n=4,854) measures the neutral evolutionary divergence since the two species diverged, while values computed between trout Ss4R paralogues (green; n=6,099) measure the divergence since the more ancient Ss4R. Both events are much younger than the teleost WGD represented by within-species comparisons of paralogues (Ts3R: stickleback, n=1,671; tetraodon, n=974; medaka, n=1,393; zebrafish, n=1,717; trout, n=1,111). Note that in order to represent all the data on the same frequency scale, bin sizes are different for each data set. (b) Evolution of salmonids and the Ss4R timing. The timing of the salmonid radiation (2) and of the speciation of Salmo and Oncorhynchus (2) was based on Crête-Lafreniere et al., and the divergence time between Esocidae and Salmonidae (1) was based on Near et al..
Figure 4
Figure 4. Conserved organization of the Ss4R duplicated regions.
(a) Two ohnologous scaffolds (177 and 179) are aligned, showing the perfect conservation of ohnologous gene (green) order typically found in most ohnologous scaffolds. When no onhologous copy was annotated, the singleton gene copy (yellow) was used to build a gene model when possible, leading to five possible outcomes: functional (orange), pseudogene (purple), incomplete gene model (grey), absent (that is, no match, white) or ambiguous (blue). Normalised expression values are shown for each annotated protein-coding gene for 15 tissues. (b) The plots show the result of the LastZ alignment of the genomic DNA sequence of two scaffolds. The histogram underneath indicates the local percentage of nucleotide sequence identity of each LastZ High-scoring Segment Pair (HSP). The section in red corresponds to the region shown in panel (a). (c) Whisker plots (with whiskers representing the range of the distribution, excluding the 5% most extreme values) showing the distribution of percentage of nucleotide sequence identity between LastZ HSPs of 579 ohnologous scaffolds (n=85,050, red), and the percentage of amino-acid sequence identity between single-copy genes and their pseudogene model (n=1,344, green) or ohnologous gene copies between each other (n=4,032, green).
Figure 5
Figure 5. Retention of genes as ohnologues after multiple rounds of whole-genome duplication.
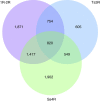
The gene content of the vertebrate ancestor (Euteleostomi) was reconstructed using Ensembl Compara gene phylogenies. We tested whether genes that were retained as 1R–2R ohnologues in the human genome, as Ts3R ohnologues in zebrafish and as Ss4R ohnologues in trout are descended from the same set of ancestral vertebrate genes. We found significant overlaps between the sets, suggesting that some gene families are preferentially retained as ohnologues after WGD events (1R–2R/Ss4R overlap: P=2.10−16; Ts3R/Ss4R overlap: P=0.03; χ2 test).
Figure 6
Figure 6. Expression of Ss4R ohnologues reveals four classes of genes.
(a) Expression levels of ohnologues across 15 tissues (pituitary gland, brain, stomach, white muscle, red muscle, gills, heart, intestine, liver, ovary, bone, skin, spleen, anterior kidney). Expression levels were normalized and centred independently for each Ss4R ohnologue. (b) Delineation of four groups of ohnologues based on (i) correlation between their expression patterns (HC: high correlation, P≤0.05; NC: no correlation, P>0.05; Pearson’s correlation test), and (ii) their relative expression levels (SE: same expression levels, P>0.05; DE: different expression levels, P≤0.05; Student’s paired t-test). Expression levels were normalized and centred across both ohnologues in the left panel, highlighting differences in relative levels of expression between both genes. Pearson’s correlation coefficients between the expression levels of both ohnologues across all tissues are represented in the right panel. (c) Top functional enrichments for each class of ohnologues, compared with the remainder of the ohnologue set. Each class of ohnologues corresponds to a functionally distinct group of genes. Enrichment P-values were obtained using Fisher’s exact test; colours highlight the fold change between expected and observed genes annotated with a given ontological term (Supplementary Table 3 for the complete list of enriched terms and methodological details). (d) Whisker plots (with whiskers representing the range of the distribution, excluding the 5% most extreme values) showing the sequence conservation for each class of ohnologues (numbers of ohnologue pairs HCSE=1,407; HCDE=1,895; NCSE=1,248; NCDE=1,573). Highly correlated ohnologues are on average significantly more conserved at the sequence level and under higher selective pressure (as described by dN/dS ratios) than non-correlated ohnologues, showing that divergence in expression patterns is associated with divergence of the coding sequence.

Similar articles

Cited by

References

    1. Ohno S. Evolution by Gene Duplication Allen and Unwin (1970).
    1. Jaillon O. et al. Genome duplication in the teleost fish Tetraodon nigroviridis reveals the early vertebrate proto-karyotype. Nature 431, 946–957 (2004). - PubMed
    1. Amores A. et al. Zebrafish hox clusters and vertebrate genome evolution. Science 282, 1711–1714 (1998). - PubMed
    1. Near T. J. et al. Resolution of ray-finned fish phylogeny and timing of diversification. Proc. Natl Acad. Sci. USA 109, 13698–13703 (2012). - PMC - PubMed
    1. Santini F., Harmon L. J., Carnevale G. & Alfaro M. E. Did genome duplication drive the origin of teleosts? A comparative study of diversification in ray-finned fishes. BMC Evol. Biol. 9, 194 (2009). - PMC - PubMed

Publication types

LinkOut - more resources