Structural model of ligand-G protein-coupled receptor (GPCR) complex based on experimental double mutant cycle data: MT7 snake toxin bound to dimeric hM1 muscarinic receptor
- PMID: 21685390
- PMCID: PMC3173127
- DOI: 10.1074/jbc.M111.261404
Structural model of ligand-G protein-coupled receptor (GPCR) complex based on experimental double mutant cycle data: MT7 snake toxin bound to dimeric hM1 muscarinic receptor
Abstract
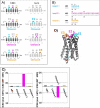
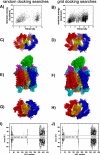
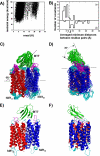
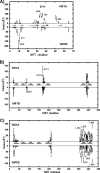
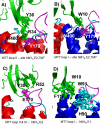
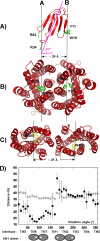
The snake toxin MT7 is a potent and specific allosteric modulator of the human M1 muscarinic receptor (hM1). We previously characterized by mutagenesis experiments the functional determinants of the MT7-hM1 receptor interaction (Fruchart-Gaillard, C., Mourier, G., Marquer, C., Stura, E., Birdsall, N. J., and Servent, D. (2008) Mol. Pharmacol. 74, 1554-1563) and more recently collected evidence indicating that MT7 may bind to a dimeric form of hM1 (Marquer, C., Fruchart-Gaillard, C., Mourier, G., Grandjean, O., Girard, E., le Maire, M., Brown, S., and Servent, D. (2010) Biol. Cell 102, 409-420). To structurally characterize the MT7-hM1 complex, we adopted a strategy combining double mutant cycle experiments and molecular modeling calculations. First, thirty-three ligand-receptor proximities were identified from the analysis of sixty-one double mutant binding affinities. Several toxin residues that are more than 25 Å apart still contact the same residues on the receptor. As a consequence, attempts to satisfy all the restraints by docking the toxin onto a single receptor failed. The toxin was then positioned onto two receptors during five independent flexible docking simulations. The different possible ligand and receptor extracellular loop conformations were described by performing simulations in explicit solvent. All the docking calculations converged to the same conformation of the MT7-hM1 dimer complex, satisfying the experimental restraints and in which (i) the toxin interacts with the extracellular side of the receptor, (ii) the tips of MT7 loops II and III contact one hM1 protomer, whereas the tip of loop I binds to the other protomer, and (iii) the hM1 dimeric interface involves the transmembrane helices TM6 and TM7. These results structurally support the high affinity and selectivity of the MT7-hM1 interaction and highlight the atypical mode of interaction of this allosteric ligand on its G protein-coupled receptor target.
Figures


Similar articles
-
Interpreting the structural mechanism of action for MT7 and human muscarinic acetylcholine receptor 1 complex by modeling protein-protein interaction.J Biomol Struct Dyn. 2012;30(1):30-44. doi: 10.1080/07391102.2012.674188. J Biomol Struct Dyn. 2012. PMID: 22571431
-
Different interactions between MT7 toxin and the human muscarinic M1 receptor in its free and N-methylscopolamine-occupied states.Mol Pharmacol. 2008 Dec;74(6):1554-63. doi: 10.1124/mol.108.050773. Epub 2008 Sep 10. Mol Pharmacol. 2008. PMID: 18784346
-
Influence of MT7 toxin on the oligomerization state of the M1 muscarinic receptor.Biol Cell. 2010 Apr 9;102(7):409-20. doi: 10.1042/BC20090171. Biol Cell. 2010. PMID: 20170475
-
Snake toxins that bind specifically to individual subtypes of muscarinic receptors.Life Sci. 2001 Apr 27;68(22-23):2541-7. doi: 10.1016/s0024-3205(01)01050-5. Life Sci. 2001. PMID: 11392624 Review.
-
m1-toxin.Life Sci. 1993;52(5-6):433-40. doi: 10.1016/0024-3205(93)90299-i. Life Sci. 1993. PMID: 8441325 Review.
Cited by
-
Synthetic Peptide Fragments of the Wtx Toxin Reduce Blood Pressure in Rats under General Anesthesia.Dokl Biochem Biophys. 2023 Dec;513(1):319-323. doi: 10.1134/S1607672923700497. Epub 2023 Sep 12. Dokl Biochem Biophys. 2023. PMID: 37700213 Free PMC article.
-
Structural and Functional Diversity of Animal Toxins Interacting With GPCRs.Front Mol Biosci. 2022 Feb 7;9:811365. doi: 10.3389/fmolb.2022.811365. eCollection 2022. Front Mol Biosci. 2022. PMID: 35198603 Free PMC article. Review.
-
Allosteric Modulator Leads Hiding in Plain Site: Developing Peptide and Peptidomimetics as GPCR Allosteric Modulators.Front Chem. 2021 Oct 7;9:671483. doi: 10.3389/fchem.2021.671483. eCollection 2021. Front Chem. 2021. PMID: 34692635 Free PMC article. Review.
-
Structure and selectivity engineering of the M1 muscarinic receptor toxin complex.Science. 2020 Jul 10;369(6500):161-167. doi: 10.1126/science.aax2517. Science. 2020. PMID: 32646996 Free PMC article.
-
Secreted Isoform of Human Lynx1 (SLURP-2): Spatial Structure and Pharmacology of Interactions with Different Types of Acetylcholine Receptors.Sci Rep. 2016 Aug 3;6:30698. doi: 10.1038/srep30698. Sci Rep. 2016. PMID: 27485575 Free PMC article.
References
-
- Takeda S., Kadowaki S., Haga T., Takaesu H., Mitaku S. (2002) FEBS Lett. 520, 97–101 - PubMed
-
- Wise A., Gearing K., Rees S. (2002) Drug Discov. Today 7, 235–246 - PubMed
-
- Pierce K. L., Premont R. T., Lefkowitz R. J. (2002) Nat. Rev. Mol. Cell Biol. 3, 639–650 - PubMed
-
- Rosenbaum D. M., Cherezov V., Hanson M. A., Rasmussen S. G., Thian F. S., Kobilka T. S., Choi H. J., Yao X. J., Weis W. I., Stevens R. C., Kobilka B. K. (2007) Science 318, 1266–1273 - PubMed
MeSH terms
Substances
LinkOut - more resources
Full Text Sources
Research Materials


