iBet uBet web content aggregator. Adding the entire web to your favor.


Link to original content: https://pubmed.ncbi.nlm.nih.gov/20975722
Sustainable biochar to mitigate global climate change - PubMed Skip to main page content
U.S. flag

An official website of the United States government

Dot gov

The .gov means it’s official.
Federal government websites often end in .gov or .mil. Before sharing sensitive information, make sure you’re on a federal government site.

Https

The site is secure.
The https:// ensures that you are connecting to the official website and that any information you provide is encrypted and transmitted securely.

Access keys NCBI Homepage MyNCBI Homepage Main Content Main Navigation
. 2010 Aug 10:1:56.
doi: 10.1038/ncomms1053.

Sustainable biochar to mitigate global climate change

Affiliations

Sustainable biochar to mitigate global climate change

Dominic Woolf et al. Nat Commun. .

Abstract

Production of biochar (the carbon (C)-rich solid formed by pyrolysis of biomass) and its storage in soils have been suggested as a means of abating climate change by sequestering carbon, while simultaneously providing energy and increasing crop yields. Substantial uncertainties exist, however, regarding the impact, capacity and sustainability of biochar at the global level. In this paper we estimate the maximum sustainable technical potential of biochar to mitigate climate change. Annual net emissions of carbon dioxide (CO(2)), methane and nitrous oxide could be reduced by a maximum of 1.8 Pg CO(2)-C equivalent (CO(2)-C(e)) per year (12% of current anthropogenic CO(2)-C(e) emissions; 1 Pg=1 Gt), and total net emissions over the course of a century by 130 Pg CO(2)-C(e), without endangering food security, habitat or soil conservation. Biochar has a larger climate-change mitigation potential than combustion of the same sustainably procured biomass for bioenergy, except when fertile soils are amended while coal is the fuel being offset.


Conflict of interest statement

D.W., J.E.A., F.A.S.-P. and J.L. declare no competing financial interests. S.J. is Chairman of Anthroterra, a company conducting research into the development of a biochar mineral complex to replace conventional fertilizers. This company plans to manufacture and sell portable pyrolysers.

Figures

Figure 1
Figure 1. Overview of the sustainable biochar concept.
The figure shows inputs, process, outputs, applications and impacts on global climate. Within each of these categories, the relative proportions of the components are approximated by the height/width of the coloured fields. CO2 is removed from the atmosphere by photosynthesis to yield biomass. A sustainable fraction of the total biomass produced each year, such as agricultural residues, biomass crops and agroforestry products, is converted by pyrolysis to yield bio-oil, syngas and process heat, together with a solid product, biochar, which is a recalcitrant form of carbon and suitable as a soil amendment. The bio-oil and syngas are subsequently combusted to yield energy and CO2. This energy and the process heat are used to offset fossil carbon emissions, whereas the biochar stores carbon for a significantly longer period than would have occurred if the original biomass had been left to decay. In addition to fossil energy offsets and carbon storage, some emissions of methane and nitrous oxide are avoided by preventing biomass decay (see Supplementary Table S5 for example) and by amending soils with biochar. Additionally, the removal of CO2 by photosynthesis is enhanced by biochar amendments to previously infertile soils, thereby providing a positive feedback. CO2 is returned to the atmosphere directly through combustion of bio-oil and syngas, through the slow decay of biochar in soils, and through the use of machinery to transport biomass to the pyrolysis facility, to transport biochar from the same facility to its disposal site and to incorporate biochar into the soil. In contrast to bioenergy, in which all CO2 that is fixed in the biomass by photosynthesis is returned to the atmosphere quickly as fossil carbon emissions are offset, biochar has the potential for even greater impact on climate through its enhancement of the productivity of infertile soils and its effects on soil GHG fluxes.
Figure 2
Figure 2. Net avoided GHG emissions.
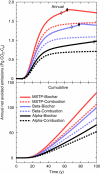
The avoided emissions are attributable to sustainable biochar production or biomass combustion over 100 years, relative to the current use of biomass. Results are shown for the three model scenarios, with those for sustainable biochar represented by solid lines and for biomass combustion by dashed lines. The top panel shows annual avoided emissions; the bottom panel, cumulative avoided emissions. Diamonds indicate transition period when biochar capacity of the top 15 cm of soil fills up and alternative disposal options are needed.
Figure 3
Figure 3. Breakdown of cumulative avoided GHG emissions (Pg CO2-Ce) from sustainable biochar production.
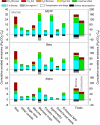
The data are for the three model scenarios over 100 years by feedstock and factor. The left side of the figure displays results for each of eight feedstock types and the additional biomass residues that are attributed to NPP increases from biochar amendments; the right side displays total results by scenario for both biochar (left column) and biomass combustion (right column). For each column, the total emission-avoiding and emission-generating contributions are given, respectively, by the height of the columns above and below the zero line. The net avoided emissions are calculated as the difference between these two values. Within each column, the portion of its contribution caused by each of six emission-avoiding mechanisms and three emission-generating mechanisms is shown by a different colour. These mechanisms (from top to bottom within each column) are (1) avoided CH4 from biomass decay, (2) increased CH4 oxidation by soil biochar, (3) avoided N2O from biomass decay, (4) avoided N2O caused by soil biochar, (5) fossil fuel offsets from pyrolysis energy production, (6) avoided CO2 emissions from carbon stored as biochar, (7) decreased carbon stored as soil organic matter caused by diversion of biomass to biochar, (8) CO2 emissions from transportation and tillage activities and (9) CO2 emissions from decomposition of biochar in soil.
Figure 4
Figure 4. Sensitivity of the model to key variables.
Sensitivity is expressed as a percentage deviation from the reported value of cumulative net avoided GHG emissions over 100 years for each scenario. Top (blue), middle (yellow) and bottom (red) bars for each variable correspond to Alpha, Beta and MSTP scenarios. Minimum and maximum values for each variable are at the ends of the bars (with additional sensitivities to recalcitrant carbon half-life of 100 and 200 years shown); baseline values of the key variables used in this study correspond to 0% deviation. See also Supplementary Table S7.
Figure 5
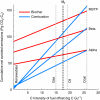
Figure 5. Cumulative mitigation potential (100 years) of biochar and biomass combustion as a function of carbon intensity of the type of energy being offset.
The black vertical dashed line labelled Mb on the upper x axis refers to the carbon intensity of the baseline energy mix assumed in this study. Grey vertical dashed lines at 15, 19 and 26 kg C GJ−1 denote the carbon intensity of natural gas, oil and coal, respectively. The carbon intensity of renewable forms of energy is close to 0 kg C GJ−1.
Figure 6
Figure 6. Soil-fertility constraints to cropland productivity (5′ resolution).
Soil fertility is indicated by hue, whereas the percentage of the gridcell currently being used as cropland is indicated by colour saturation (with white indicating the absence of cropland in a grid cell).
Figure 7
Figure 7. Cumulative mitigation potential of biochar relative to bioenergy.
The mitigation potential is reported as a function of both soil fertility and carbon intensity of the type of energy being offset (in the MSTP scenario). Points Mew, Mw and Mb on the upper x axis refer to the carbon intensity of the current world electricity mix, the current world primary energy mix and the baseline energy mix assumed in our scenarios, respectively. Carbon intensity values for natural gas, oil and coal are also indicated. The relative mitigation is calculated as cumulative avoided emissions for biochar minus those for bioenergy, expressed as a fraction of the avoided emissions for bioenergy (for example, a value of 0.1 indicates that the cumulative mitigation impact of biochar is 10% greater than that of bioenergy, a value of −0.1 indicates that it is 10% lower and a value of zero indicates that they have the same mitigation impact). The soil-fertility classifications marked on the vertical axis correspond to the soil categories mapped in Figure. 6. Panel a (Residues) includes agricultural and forestry residues, together with green waste, as biomass inputs; Panel b (Biomass crops) includes both dedicated biomass crops and agroforestry products as biomass inputs. Panel c (Manures), includes bovine, pig and poultry manure as biomass inputs. Panel d (Total) includes all sources of biomass inputs in the proportions assumed in our model. An analogous figure for the Alpha scenario is shown as Supplementary Figure S10.

Similar articles

Cited by

References

    1. Raupach M. R. et al.. Global and regional drivers of accelerating CO2 emissions. PNAS 104, 10288–10293 (2007). - PMC - PubMed
    1. Solomon S., Plattner G., Knutti R. & Friedlingstein P. Irreversible climate change due to carbon dioxide emissions. PNAS 106, 1704–1709 (2009). - PMC - PubMed
    1. Broecker W. S. Climate change: CO2 arithmetic. Science 315, 1371 (2007). - PubMed
    1. Matthews H. D. & Caldeira K. Stabilizing climate requires near-zero emissions. Geophys. Res. Lett. 35, L04705 (2008).
    1. Allen M. R. et al.. Warming caused by cumulative carbon emissions towards the trillionth tonne. Nature 458, 1163–1166 (2009). - PubMed

Publication types