iBet uBet web content aggregator. Adding the entire web to your favor.


Link to original content: https://pubmed.ncbi.nlm.nih.gov/20880086/
Salmonid T cells assemble in the thymus, spleen and in novel interbranchial lymphoid tissue - PubMed Skip to main page content
U.S. flag

An official website of the United States government

Dot gov

The .gov means it’s official.
Federal government websites often end in .gov or .mil. Before sharing sensitive information, make sure you’re on a federal government site.

Https

The site is secure.
The https:// ensures that you are connecting to the official website and that any information you provide is encrypted and transmitted securely.

Access keys NCBI Homepage MyNCBI Homepage Main Content Main Navigation
. 2010 Dec;217(6):728-39.
doi: 10.1111/j.1469-7580.2010.01305.x. Epub 2010 Sep 29.

Salmonid T cells assemble in the thymus, spleen and in novel interbranchial lymphoid tissue

Affiliations

Salmonid T cells assemble in the thymus, spleen and in novel interbranchial lymphoid tissue

Erling O Koppang et al. J Anat. 2010 Dec.

Abstract

In modern bony fishes, or teleost fish, the general lack of leucocyte markers has greatly hampered investigations of the anatomy of the immune system and its reactions involved in inflammatory responses. We have previously reported the cloning and sequencing of the salmon CD3 complex, molecules that are specifically expressed in T cells. Here, we generate and validate sera recognizing a peptide sequence of the CD3ε chain. Flow cytometry analysis revealed high numbers of CD3ε(+) or T cells in the thymus, gill and intestine, whereas lower numbers were detected in the head kidney, spleen and peripheral blood leucocytes. Subsequent morphological analysis showed accumulations of T cells in the thymus and spleen and in the newly discovered gill-located interbranchial lymphoid tissue. In the latter, the T cells are embedded in a meshwork of epithelial cells and in the spleen, they cluster in the white pulp surrounding ellipsoids. The anatomical organization of the salmonid thymic cortex and medulla seems to be composed of three layers consisting of a sub-epithelial medulla-like zone, an intermediate cortex-like zone and finally another cortex-like basal zone. Our study in the salmonid thymus reports a previously non-described tissue organization. In the intestinal tract, abundant T cells were found embedded in the epithelium. In non-lymphoid organs, the presence of T cells was limited. The results show that the interbranchial lymphoid tissue is quantitatively a very important site of T cell aggregation, strategically located to facilitate antigen encounter. The interbranchial lymphoid tissue has no resemblance to previously described lymphoid tissues.


Figures

Fig. 1
Fig. 1
Macroscopical and histological location and appearance of the interbranchial lymphoid tissue (ILT), here in sexually mature salmon. (A) In a transversal section of a gill arch, the interbranchial septum (is) is proximally attached to the bone of the gill arch (b) and continues approximately 1/3 along the length of the primary gill lamella terminating in the ILT, which may be observed as a greyish structure (arrow) by the naked eye. The lumen of the branchial chamber (lu) is indicated. (B) Samples were collected from the dorsal (I), mid- (II) and ventral (III) portion of each gill arch; the location of the lymphoid aggregate in this projection is indicated (arrow), as is the location of the bone (b). (C) Histological image showing the terminal end of the interbranchial septum (is) and the ILT (arrow). HE. Scale bars: A,B = 1 cm, C = 500 μm.
Fig. 2
Fig. 2
Atlantic salmon CD3/FLAG plasmid construct. Primers used for the construction of the plasmid are in bold. The signal peptide and FLAG epitope are underlined. The transmembrane peptide is indicated in italics, and the peptide used for production of CD3 rabbit antisera is shown in bold and double underlined. The polypeptide, including the signal peptide and FLAG epitope, is 188 amino acids long, has a theoretical molecular weight of 20.7 kD, and does not have acceptor groups for N-glycosylation. Searches in the databanks revealed two ESTs encoding salmonid CD3ε: EL558160.1, Oncorhynchus tshawytscha, and EV381695.1, Oncorhynchus nerka. Both of these sequences were identical to that of Atlantic salmon with respect to the peptide used for immunization of rabbits, indicating that the resulting anti-CD3ε-serum is useful for salmonid fish in general.
Fig. 3
Fig. 3
Immunofluorescence of COS-7 cells transfected with the CD3 FLAG expressing plasmid. Cells have been permeabilized and show a cytoplasmic green fluorescence, visualized with (A) anti-FLAG antibody followed by anti-mouse Alexa fluor 488 (positive control) and (B) anti-CD3ε serum and anti-rabbit Alexa fluor 488 secondary antibody. Propidium iodide (PI) counterstain in red.
Fig. 4
Fig. 4
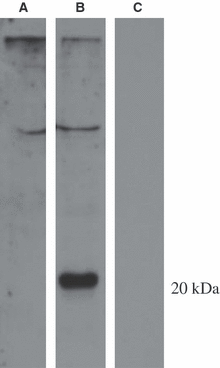
Western blot of lysates from cells transfected with FLAG plasmids showing specificity of anti-CD3ε-serum at the expected MW of 20 kD (arrow). Lanes 1 and 2: CD3ε-FLAG transfected cell lysate. Lane 3: cell lysate from transfected cells with an irrelevant FLAG construct. Lane 1: incubation with pre-immune serum. Lanes 2 and 3: incubation with anti-CD3ε-serum.
Fig. 5
Fig. 5
Western blot of crude tissue homogenates from Atlantic salmon probed with two affinity-purified rabbit polyclonal anti-CD3ε-sera. The expected molecular mass of salmon CD3ε is 17–19 kDa. Both antisera detected a prominent band of approximately 19 kDa from the thymus (lanes 6 and 12), strong, albeit less distinct, with gill preparations (lanes 2, 3, 8 and 9). A weak reactivity was detected with spleen (lanes 1 and 7), whereas no reactivity was recorded with head-kidney (lanes 5 and 11). The sera from the two rabbits reacted in a similar fashion in this experiment, but only sera from rabbit no. 2 was used in the other experiments presented here.
Fig. 6
Fig. 6
Percentages of CD3ε+ cells in rainbow trout leucocytes separated from different lymphoid tissues and peripheral blood measured by flow cytometry. Mean values are calculated from four different individuals using the two different anti-CD3ε sera (n = 8).
Fig. 7
Fig. 7
Double-flow cytometry analysis with rainbow trout splenocytes using the anti-CD3ε antisera and population specific antibodies for thrombocytes and IgM+ lymphocytes. (A) Double-labelling with a thrombocyte specific mAb. The figure shows an Alexa488 (FL1) against TriColor (FL4) dot plot. CD3ε single-positive cells are depicted in the lower right quadrant, thrombocytes in the upper left quadrant, while double-negative cells appear in the lower left quadrant. A negligible number of double-positive cells (0.01%) remain in the upper right quadrant. (B) Double-flow cytometry analysis using the CD3ε antiserum and mAbs specific for rainbow trout IgM. The figure shows an Alexa488 (FL1) against TriColor (FL4) dot plot. CD3ε single-positive cells are depicted in the lower right quadrant, IgM+ cells in the upper left quadrant, while double-negative cells appear in the lower left quadrant. A negligible number of double-positive cells (0.13%) were found in the upper right quadrant. The images depict a typical experiment repeated with four different individuals.
Fig. 8
Fig. 8
Immunomorphological and morphological analysis of the salmonid ILT, with the lumen of the branchial chamber indicated (lu). (A) Abundant CD3ε+ (red) cells between the interbranchial septum (is) and the lumen of the branchial chamber. (B) Polarized cells attached to the basal membrane (arrowheads) covered by CD3ε+ (red) cells. (C) Towards the lumen (lu) of the branchial chamber, CD3ε+ cells are more scattered and are covered by an epithelial cell layer containing goblet cells (arrowhead). (D) Strong CD3ε staining (green) of the ILT located between the basal membrane (arrowhead) and the branchial lumen (lu). PI counterstaining in red. (E) Staining for cytokeratin (green) reveals a meshwork of interstitial cells. (F) CD3ε+ cells (green) embedded in the meshwork of cytokeratin+ cells (red) of the interstitium. (G) Very few Ig+ cells (green) are present in the ILT. PI counterstaining in red. Scale bars: A = 200 μm, B,C = 40 μm, D,E,G = 80 μm, F = 60 μm.
Fig. 9
Fig. 9
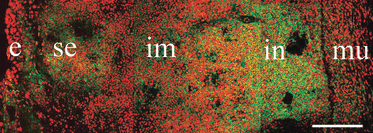
Anti-CD3 immunostain in section of frozen trout thymus. Immunoreactive cells (green) are found beneath the epithelium (e) in the sub-epithelial zone (se), embedded in clusters within the intermediate zone (im) and in great numbers at the base of the organ in the internal zone (in). Immunonegative muscle (mu) is seen at the very base of the organ. PI counterstaining in red. Scale bar: 120 μm.
Fig. 10
Fig. 10
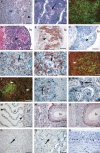
Anti-CD3ε immunostain in Atlantic salmon formalin-fixed and paraffin-embedded tissues (A,B,D–H,K–R) (red reaction, haematoxylin counterstained) or in cryosections from trout (C,I,J) (green fluorescence, PI counterstaining in red). (A) Thymus with capsule (arrowhead) and abundant CD3ε+ cells in the sub-epithelial zone (se) compared to deeper portions or intermediate zone (im). (B) Thymic intermediate cortex-like zone with island of CD3ε+ cells (arrow). (C) Abundant CD3ε+ cells in subcapsular areas. (D–F) Thymus of sexually mature salmon. Structures similar to corpuscles of Hassal (arrowheads). Branchial lumen is indicated (lu). The lymphocytes appear mature, and a distinction between outer and inner zone is not evident. A thin epithelial capsular structure encapsulates the luminal surface. (D) H&E staining. (E) CD3ε+ lymphocytes (red reaction, haematoxylin counterstain) within the thymus parenchyma and with no reactivity in the capsular and underlying structures. (F) MHC class II+ cells (red staining). (G,H) Spleen with CD3ε+ cells in white pulp arranged around ellipsoids (arrows). (I) A follicle-like appearance of CD3ε+ cells (green) in spleen (arrowhead), but this can be explained with a denser distribution round ellipsoids. (J) Occasionally, immunoreactive splenic cells associate with melanomacrophages (arrowheads). (K) Scattered CD3ε+ cells in head-kidney. Teleost adrenal homologue (a). Scattered melanomacrophages (arrow). (L) Strongly CD3ε+ cells scattered in the mid-kidney and occasionally in tubuli (t). Negative glomeruli (gl) and scattered melanomacrophages (arrow). (M) Scattered CD3ε+ cells (arrowheads) in primary (pl) and secondary (sl) gill lamellae. (N) Posterior gut segment with CD3ε+ cells. The intestinal lumen (lu) is indicated. (O) Anterior gut segment with more dispersed CD3ε+ cells. (P) CD3ε+ cells in liver (arrow), (Q) heart muscle (arrow) and (R) limbus region of the eye (several cells). Scale bars: A = 100 μm, B,D–G, K–R = 50 μm, C,I,J = 60 μm, H = 20 μm.

Similar articles

Cited by

References

    1. Alder MN, Herrin BR, Sadlonova A, et al. Antibody responses of variable lymphocyte responses in the lamprey. Nat Immunol. 2008;9:319–327. - PubMed
    1. Boehm T, Bleul CC. The evolutionary history of lymphoid organs. Nat Immunol. 2007;8:131–135. - PubMed
    1. Bowden TJ, Cook P, Rombout JH. Development and function of the thymus in teleosts. Fish Shellfish Immunol. 2005;19:413–427. - PubMed
    1. Brandtzaeg P, Kiyono H, Pabst R, et al. Terminology: nomenclature of the mucosa-associated lymphoid tissue. Mucosal Immunol. 2008;1:31–37. - PubMed
    1. Chen K, Xu W, Wilson M, et al. Immunoglobulin D enhances immune surveillance by activating antimicrobial, proinflammatory and B cell-stimulating programs in basophils. Nat Immunol. 2009;10:889–898. - PMC - PubMed

LinkOut - more resources