iBet uBet web content aggregator. Adding the entire web to your favor.


Link to original content: https://pubmed.ncbi.nlm.nih.gov/20836007
Pharmacogenomics: a systems approach - PubMed Skip to main page content
U.S. flag

An official website of the United States government

Dot gov

The .gov means it’s official.
Federal government websites often end in .gov or .mil. Before sharing sensitive information, make sure you’re on a federal government site.

Https

The site is secure.
The https:// ensures that you are connecting to the official website and that any information you provide is encrypted and transmitted securely.

Access keys NCBI Homepage MyNCBI Homepage Main Content Main Navigation
Review
. 2010 Jan-Feb;2(1):3-22.
doi: 10.1002/wsbm.42.

Pharmacogenomics: a systems approach

Affiliations
Review

Pharmacogenomics: a systems approach

Liewei Wang. Wiley Interdiscip Rev Syst Biol Med. 2010 Jan-Feb.

Abstract

Pharmacogenetics and pharmacogenomics involve the study of the role of inheritance in individual variation in drug response, a phenotype that varies from potentially life-threatening adverse drug reactions to equally serious lack of therapeutic efficacy. Pharmacogenetics-pharmacogenomics represents a major component of the movement to 'individualized medicine'. Pharmacogenetic studies originally focused on monogenic traits, often involving genetic variation in drug metabolism. However, contemporary studies increasingly involve entire 'pathways' that include both pharmacokinetics (PKs)--factors that influence the concentration of a drug reaching its target(s)--and pharmacodynamics (PDs), factors associated with the drug target(s), as well as genome-wide approaches. The convergence of advances in pharmacogenetics with rapid developments in human genomics has resulted in the evolution of pharmacogenetics into pharmacogenomics. At the same time, studies of drug response are expanding beyond genomics to encompass pharmacotranscriptomics and pharmacometabolomics to become a systems-based discipline. This discipline is also increasingly moving across the 'translational interface' into the clinic and is being incorporated into the drug development process and governmental regulation of that process. The article will provide an overview of the development of pharmacogenetics-pharmacogenomics, the scientific advances that have contributed to the continuing evolution of this discipline, the incorporation of transcriptomic and metabolomic data into attempts to understand and predict variation in drug response phenotypes as well as challenges associated with the 'translation' of this important aspect of biomedical science into the clinic.


Figures

FIGURE 1
FIGURE 1
The evolution of pharmacogenetics and pharmacogenomics. Pharmacogenomics has evolved from a single gene approach to incorporate pathway-based and genome-wide approaches (left side of the diagram). In parallel, it has increasingly incorporated a variety of high-throughput technologies including genomics, transcriptomics, metabolomics, and proteomics to significantly enhance the ability to generate and test pharmacogenomic hypotheses and to translate those hypotheses into clinical practice. PK, pharmacokinetics; PD, pharmacodynamics.
FIGURE 2
FIGURE 2
(a) Butyrylcholinesterase (BCHE) genetic variation. The figure shows data for 135 members of 7 unrelated families selected on the basis of a proband with atypical BCHE. These subjects were phenotyped for percentage inhibition of BCHE by dibucaine. Subjects homozygous for the trait of atypical BCHE are shown at the far left. (b) N-Acetyltransferase 2 genetic variation. Plasma concentrations of isoniazid in 267 subjects 6 hours after the administration of an identical oral dose are shown. The bimodal frequency distribution results from polymorphisms in the NAT2 gene. (Modified with permission from Refs 12,. Copyright 1957, 1960 BMJ Publishing Group).
FIGURE 3
FIGURE 3
Plasma dicumarol and antipyrine half-life values in monozygotic and dizygotic twin pairs. (Data from Vesell and Page with permission).
FIGURE 4
FIGURE 4
Thiopurine S-methyltransferase (TPMT) pharmacogenetics. The frequency distribution shows the level of red blood cell (RBC) TPMT activity in 298 randomly selected Caucasian blood donors. Presumed genotypes for the TPMT genetic polymorphism are also shown. TPMTL and TPMTH (low and high, respectively) were allele designations used before the molecular basis for the polymorphism was established. (Modified with permission from Ref 28. Copyright 1980 the American Society of Human Genetics).
FIGURE 5
FIGURE 5
Human thiopurine S-methyltransferase (TPMT) alleles. TPMT *1 is the most common allele (wild type), TPMT *3A is the most common variant allele in Caucasians, and TPMT *3C is the most common variant allele in East Asian subjects. Rectangles represent exons, with blue areas representing the open reading frame. Arrows indicate the locations of two common single nucleotide polymorphisms (SNPs) as well as a 5′-flanking region GC-rich variable number of tandem repeats (VNTR). (Modified with permission from Ref 29. Copyright 2006 Annual Reviews www.annualreviews.org).
FIGURE 6
FIGURE 6
The dynamic balance among protein folding, proteasome-mediated degradation, and aggresome formation. The figure depicts various fates for a protein, including proper folding (Pathway 1), misfolding followed by ubiquitination and proteasome-mediated degradation (Pathway 2), or aggresome formation (Pathway 3). (Modified with permission from Ref 38. Copyright 2006 Nature Publishing Group).
FIGURE 7
FIGURE 7
Cytochrome P450 2D6 (CYP2D6) pharmacogenetics. The frequency distribution of the ratio of debrisoquine to its metabolite 4-hydroxydebrisoquine in 1011 Swedish subjects is shown. `Cutoff' marks the demarcation between PMs and EMs. PM, poor metabolizer; EM, extensive metabolizer; UM, ultrarapid metabolizer. (Modified with permission from Ref 42. Copyright 1992 Nature Publishing Group).
FIGURE 8
FIGURE 8
Kaplan-Meier curves for 190 women with breast cancer who were treated with tamoxifen and were genotyped for CYP2D6*4. Wt, wild type. (a) Relapse-free time, (b) disease-free survival, and (c) overall survival for patients with the CYP2D6 genotypes indicated. (Modified with permission from Ref 56. Copyright 2005 American Society of Clinical Oncology).
FIGURE 9
FIGURE 9
Warfarin pharmacogenomics. The figure shows a schematic representation of pharmacokinetic (CYP2C9-dependent) and pharmacodynamic (VKORC1-dependent) pharmacogenomic factors that influence the final dose of warfarin. (Modified with permission from Ref 29. Copyright 2006 Annual Reviews www.annualreviews.org).
FIGURE 10
FIGURE 10
The figure shows a schematic representation of the `glutathione pathway.' Glutathione is synthesized from glutamate (Glu), cysteine (Cys), and glycine (Gly) by γ-glutamylcysteine synthetase and glutathione synthetase. Glutathione redox state is regulated, in part, by glutathione peroxidases, forming oxidized glutathione (GSSG), and by a reaction catalyzed by glutathione reductase. Glutathione is conjugated to substrates both through the action of the glutathione S-transferases and through nonenzymatic reactions. Glutathione conjugates can be excreted from cells by members of the ABCC transporter family.
FIGURE 11
FIGURE 11
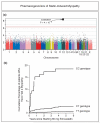
Genome-wide association study (GWAS) of statin-induced myopathy. (a) Association between statin-induced myopathy and each SNP assayed in the GWAS. The x-axis shows the location of SNPs in the genome by chromosome, while the y-axis shows the—log10 of the p value for each SNP. (b) Estimated cumulative incidence of myopathy associated with 80 mg of simvastatin daily by genotype at SNP rs4363657. (Modified with permission from Ref 90. Copyright 2008 Massachusetts Medical Society).
FIGURE 12
FIGURE 12
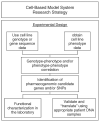
Diagrammatic outline of the use of a cell line-based model system to identify and both functionally and clinically validate pharmacogenomic candidate genes. DNA, deoxyribonucleic acid. (Modified with permission from Ref 92. Copyright 2008 Oxford University Press).
FIGURE 13
FIGURE 13
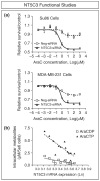
Functional validation of a candidate gene identified using the lymphoblastoid cell line model system. (a) siRNA knockdown of NT5C3 in cancer cell lines shifts the dose–response curves for AraC to the left, as anticipated. (b) Inverse correlation between NT5C3 mRNA levels and levels of AraC phosphorylated active metabolites in lymphoblastoid cells. (Modified with permission from Ref 107. Copyright 2008 AACR).
FIGURE 14
FIGURE 14
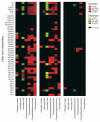
Heat map showing differences in individual lipid metabolites in the plasma of patients with schizophrenia posttreatment as compared with pretreatment using olanzapine (top panel), risperidone (middle panel), and aripiprazole (bottom panel). Fatty acid metabolites are shown as they appear in each distinct lipid class. The percent increase in any lipid after drug treatment is shown in red squares and decreases in green squares. The brightness of each color corresponds to the magnitude of the difference in quartiles. The brighter the square the larger the difference. PUFA, polyunsaturated fatty acids; MUFA, monounsaturated fatty acids; SFA, saturated fatty acids; LC, long chain. (Modified with permission from Ref 130. Copyright 2007 Annual Reviews www.annualreviews.org).

Similar articles

Cited by

References

    1. Guttmacher AE, Collins FS. Realising the promise of genomics in biomedical research. JAMA. 2005;294:1399–1402. - PubMed
    1. Weinshilboum RM. The therapeutic revolution. Clin Pharmacol Ther. 1987;42:481–484. - PubMed
    1. Vesell ES, Page JG. Genetic control of drug levels in man: antipyrine. Science. 1968;161:72–73. - PubMed
    1. Vesell ES, Page JG. Genetic control of dicumarol levels in man. J Clin Invest. 1968;47:2657–2663. - PMC - PubMed
    1. Kalow W. Pharmacogenetics: Heredity and the Response to Drugs. WB Saunders; Philadelphia, London: 1962.

Publication types

MeSH terms

Substances

LinkOut - more resources