3D comparison of low, intermediate, and advanced hippocampal atrophy in MCI
- PMID: 20143386
- PMCID: PMC2938765
- DOI: 10.1002/hbm.20905
3D comparison of low, intermediate, and advanced hippocampal atrophy in MCI
Erratum in
- Hum Brain Mapp. 2010 Dec;31(12):2015
Abstract
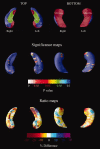
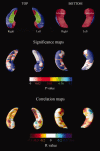
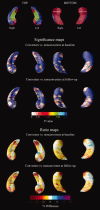
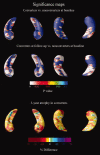
We applied the hippocampal radial atrophy mapping technique to the baseline and follow-up magnetic resonance image data of 169 amnestic mild cognitive impairment (MCI) participants in the imaging arm of the Alzheimer's Disease Cooperative Study MCI Donepezil/Vitamin E trial. Sixty percent of the subjects with none to mild hippocampal atrophy rated with the visual medial temporal atrophy rating scale (MTA score < 2) and 33.8% of the subjects with moderate to severe (MTA > or = 2) hippocampal atrophy converted to Alzheimer's disease (AD) during 3-year follow-up. MTA > or = 2 showed a trend for greater left sided hippocampal atrophy versus MTA < 2 groups at baseline (P(corrected) = 0.08). Higher MTA scores were associated with progressive atrophy of the subiculum and the CA1-3 subregions. The MTA < 2 group demonstrated significant bilateral atrophy progression at follow-up (left P(corrected) = 0.008; right P(corrected) = 0.05). Relative to MTA < 2 nonconverters, MTA < 2 converters showed further involvement of the subiculum and CA1 and additional involvement of CA2-3 at follow-up. Right CA1 atrophy was significantly associated with conversion to dementia (for 1 mm greater right CA1 radial distance subjects had 50% reduced hazard for conversion). Greater CA1 and subicular atrophy can be demonstrated early and is predictive of future conversion to AD, whereas CA2-3 involvement becomes more evident as the disease progresses.
Figures


Similar articles
-
Conversion of mild cognitive impairment to Alzheimer disease predicted by hippocampal atrophy maps.Arch Neurol. 2006 May;63(5):693-9. doi: 10.1001/archneur.63.5.693. Arch Neurol. 2006. PMID: 16682538
-
Medial temporal lobe atrophy on MRI scans and the diagnosis of Alzheimer disease.Neurology. 2008 Dec 9;71(24):1986-92. doi: 10.1212/01.wnl.0000336925.79704.9f. Neurology. 2008. PMID: 19064880 Free PMC article.
-
3D comparison of hippocampal atrophy in amnestic mild cognitive impairment and Alzheimer's disease.Brain. 2006 Nov;129(Pt 11):2867-73. doi: 10.1093/brain/awl274. Epub 2006 Oct 3. Brain. 2006. PMID: 17018552
-
Subregional hippocampal atrophy predicts Alzheimer's dementia in the cognitively normal.Neurobiol Aging. 2010 Jul;31(7):1077-88. doi: 10.1016/j.neurobiolaging.2008.08.008. Epub 2008 Sep 24. Neurobiol Aging. 2010. PMID: 18814937 Free PMC article.
-
Potential predictors of hippocampal atrophy in Alzheimer's disease.Drugs Aging. 2011 Jan 1;28(1):1-11. doi: 10.2165/11586390-000000000-00000. Drugs Aging. 2011. PMID: 21174483 Review.
Cited by
-
Relationship between hippocampal subfield volumes and cognitive decline in healthy subjects.Front Aging Neurosci. 2023 Dec 7;15:1284619. doi: 10.3389/fnagi.2023.1284619. eCollection 2023. Front Aging Neurosci. 2023. PMID: 38131011 Free PMC article.
-
Hierarchical based classification method based on fusion of Gaussian map descriptors for Alzheimer diagnosis using T1-weighted magnetic resonance imaging.Sci Rep. 2023 Aug 23;13(1):13734. doi: 10.1038/s41598-023-40635-2. Sci Rep. 2023. PMID: 37612307 Free PMC article.
-
Diffeomorphic Surface Registration with Atrophy Constraints.SIAM J Imaging Sci. 2016;9(3):975-1003. doi: 10.1137/15m104431x. Epub 2016 Jul 13. SIAM J Imaging Sci. 2016. PMID: 35646228 Free PMC article.
-
Cortical Surface Shape Analysis Based on Alexandrov Polyhedra.Proc IEEE Int Conf Comput Vis. 2021 Oct;2021:14224-14232. doi: 10.1109/iccv48922.2021.01398. Proc IEEE Int Conf Comput Vis. 2021. PMID: 35291440 Free PMC article.
-
Anatomically Standardized Detection of MRI Atrophy Patterns in Early-Stage Alzheimer's Disease.Brain Sci. 2021 Nov 11;11(11):1491. doi: 10.3390/brainsci11111491. Brain Sci. 2021. PMID: 34827490 Free PMC article.
References
-
- Apostolova LG, Dinov ID, Dutton RA, Hayashi KM, Toga AW, Cummings JL, Thompson PM ( 2006a): 3D comparison of hippocampal atrophy in amnestic mild cognitive impairment and Alzheimer's disease. Brain 129 ( Pt 11): 2867–2873. - PubMed
-
- Apostolova LG, Dutton RA, Dinov ID, Hayashi KM, Toga AW, Cummings JL, Thompson PM ( 2006b): Conversion of mild cognitive impairment to Alzheimer disease predicted by hippocampal atrophy maps. Arch Neurol 63: 693–699. - PubMed
-
- Apostolova LG, Mosconi L, Thompson PM, Green AE, Hwang KS, Ramirez A, Mistur R, Tsui WH, de Leon MJ ( 2008): Subregional hippocampal atrophy predicts future decline to Alzheimer's dementia in cognitively normal subjects. Neurobiol Aging (epub ahead of print). doi: 10.1016/j.neurobiolaging. 2008.08.008. - PMC - PubMed
-
- Bobinski M, Wegiel J, Wisniewski HM, Tarnawski M, Reisberg B, Mlodzik B, de Leon MJ, Miller DC ( 1995): Atrophy of hippocampal formation subdivisions correlates with stage and duration of Alzheimer disease. Dementia 6: 205–210. - PubMed
-
- Bobinski M, Wegiel J, Tarnawski M, Bobinski M, Reisberg B, de Leon MJ, Miller DC, Wisniewski HM ( 1997): Relationships between regional neuronal loss and neurofibrillary changes in the hippocampal formation and duration and severity of Alzheimer disease. J Neuropathol Exp Neurol 56: 414–420. - PubMed
Publication types
MeSH terms
Substances
Grants and funding
- R01 AG0210028/AG/NIA NIH HHS/United States
- U01 AG10483/AG/NIA NIH HHS/United States
- P41 RR013642-12/RR/NCRR NIH HHS/United States
- R21 RR019771/RR/NCRR NIH HHS/United States
- U19 AG010483/AG/NIA NIH HHS/United States
- EB01651/EB/NIBIB NIH HHS/United States
- AG16570/AG/NIA NIH HHS/United States
- R01 MH071940-05/MH/NIMH NIH HHS/United States
- R01 AG021028-05/AG/NIA NIH HHS/United States
- RR019771/RR/NCRR NIH HHS/United States
- U01 AG010483-18/AG/NIA NIH HHS/United States
- U54 RR021813/RR/NCRR NIH HHS/United States
- R01 AG021028/AG/NIA NIH HHS/United States
- LM05639/LM/NLM NIH HHS/United States
- R21 RR019771-02/RR/NCRR NIH HHS/United States
- P30 AG010129/AG/NIA NIH HHS/United States
- R01 MH071940/MH/NIMH NIH HHS/United States
- P30 AG10129/AG/NIA NIH HHS/United States
- K23 AG026803-05/AG/NIA NIH HHS/United States
- P30 AG010129-18/AG/NIA NIH HHS/United States
- P30 AG010129-19S1/AG/NIA NIH HHS/United States
- K23 AG026803/AG/NIA NIH HHS/United States
- U54 RR021813-01/RR/NCRR NIH HHS/United States
- U01 AG010483/AG/NIA NIH HHS/United States
- P41 RR013642/RR/NCRR NIH HHS/United States
LinkOut - more resources
Full Text Sources
Other Literature Sources
Medical
Miscellaneous


