A model of the lower limb for analysis of human movement
- PMID: 19957039
- PMCID: PMC2903973
- DOI: 10.1007/s10439-009-9852-5
A model of the lower limb for analysis of human movement
Abstract
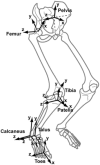
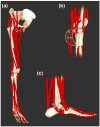
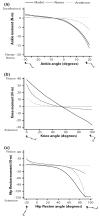
Computer models that estimate the force generation capacity of lower limb muscles have become widely used to simulate the effects of musculoskeletal surgeries and create dynamic simulations of movement. Previous lower limb models are based on severely limited data describing limb muscle architecture (i.e., muscle fiber lengths, pennation angles, and physiological cross-sectional areas). Here, we describe a new model of the lower limb based on data that quantifies the muscle architecture of 21 cadavers. The model includes geometric representations of the bones, kinematic descriptions of the joints, and Hill-type models of 44 muscle-tendon compartments. The model allows calculation of muscle-tendon lengths and moment arms over a wide range of body positions. The model also allows detailed examination of the force and moment generation capacities of muscles about the ankle, knee, and hip and is freely available at www.simtk.org .
Figures


Similar articles
-
Sensitivity of model predictions of muscle function to changes in moment arms and muscle-tendon properties: a Monte-Carlo analysis.J Biomech. 2012 May 11;45(8):1463-71. doi: 10.1016/j.jbiomech.2012.02.023. Epub 2012 Apr 14. J Biomech. 2012. PMID: 22507351
-
Influence of joint models on lower-limb musculo-tendon forces and three-dimensional joint reaction forces during gait.Proc Inst Mech Eng H. 2012 Feb;226(2):146-60. doi: 10.1177/0954411911431396. Proc Inst Mech Eng H. 2012. PMID: 22468466
-
Why are Antagonist Muscles Co-activated in My Simulation? A Musculoskeletal Model for Analysing Human Locomotor Tasks.Ann Biomed Eng. 2017 Dec;45(12):2762-2774. doi: 10.1007/s10439-017-1920-7. Epub 2017 Sep 12. Ann Biomed Eng. 2017. PMID: 28900782 Free PMC article.
-
Contributions to the understanding of gait control.Dan Med J. 2014 Apr;61(4):B4823. Dan Med J. 2014. PMID: 24814597 Review.
-
On validation of multibody musculoskeletal models.Proc Inst Mech Eng H. 2012 Feb;226(2):82-94. doi: 10.1177/0954411911431516. Proc Inst Mech Eng H. 2012. PMID: 22468460 Review.
Cited by
-
Multibody dynamics-based musculoskeletal modeling for gait analysis: a systematic review.J Neuroeng Rehabil. 2024 Oct 5;21(1):178. doi: 10.1186/s12984-024-01458-y. J Neuroeng Rehabil. 2024. PMID: 39369227 Free PMC article.
-
The impacts of muscle-specific force-velocity properties on predictions of mouse muscle function during locomotion.Front Bioeng Biotechnol. 2024 Jul 23;12:1436004. doi: 10.3389/fbioe.2024.1436004. eCollection 2024. Front Bioeng Biotechnol. 2024. PMID: 39108597 Free PMC article.
-
The effect of screw insertion configuration of Sinus Tarsi plate on biomechanical performance using finite element analysis.Sci Rep. 2024 Jul 30;14(1):17669. doi: 10.1038/s41598-024-68662-7. Sci Rep. 2024. PMID: 39085382 Free PMC article.
-
Impact of different landing heights on the contact force in the medial tibiofemoral compartment and the surrounding muscle force characteristics in drop jumps.PLoS One. 2024 Jul 19;19(7):e0307538. doi: 10.1371/journal.pone.0307538. eCollection 2024. PLoS One. 2024. PMID: 39028745 Free PMC article.
-
ArborSim: Articulated, branching, OpenSim routing for constructing models of multi-jointed appendages with complex muscle-tendon architecture.PLoS Comput Biol. 2024 Jul 5;20(7):e1012243. doi: 10.1371/journal.pcbi.1012243. eCollection 2024 Jul. PLoS Comput Biol. 2024. PMID: 38968305 Free PMC article.
References
-
- Arnold AS, Asakawa DJ, Delp SL. Do the hamstrings and adductors contribute to excessive internal rotation of the hip in persons with cerebral palsy? Gait Posture. 2000;11:181–190. - PubMed
-
- Arnold AS, Blemker SS, Delp SL. Evaluation of a deformable musculoskeletal model for estimating muscle-tendon lengths during crouch gait. Ann Biomed Eng. 2001;29:263–274. - PubMed
-
- Arnold AS, Salinas S, Asakawa DJ, Delp SL. Accuracy of muscle moment arms estimated from MRI-based musculoskeletal models of the lower extremity. Comput Aided Surg. 2000;5:108–119. - PubMed
-
- Blemker SS, Delp SL. Rectus femoris and vastus intermedius fiber excursions predicted by three-dimensional muscle models. J Biomech. 2006;39:1383–1391. - PubMed
Publication types
MeSH terms
Grants and funding
LinkOut - more resources
Full Text Sources
Other Literature Sources


