Tn-seq: high-throughput parallel sequencing for fitness and genetic interaction studies in microorganisms
- PMID: 19767758
- PMCID: PMC2957483
- DOI: 10.1038/nmeth.1377
Tn-seq: high-throughput parallel sequencing for fitness and genetic interaction studies in microorganisms
Abstract
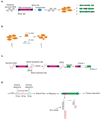
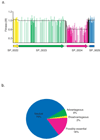
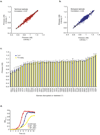
Biological pathways are structured in complex networks of interacting genes. Solving the architecture of such networks may provide valuable information, such as how microorganisms cause disease. Here we present a method (Tn-seq) for accurately determining quantitative genetic interactions on a genome-wide scale in microorganisms. Tn-seq is based on the assembly of a saturated Mariner transposon insertion library. After library selection, changes in frequency of each insertion mutant are determined by sequencing the flanking regions en masse. These changes are used to calculate each mutant's fitness. Using this approach, we determined fitness for each gene of Streptococcus pneumoniae, a causative agent of pneumonia and meningitis. A genome-wide screen for genetic interactions of five query genes identified both alleviating and aggravating interactions that could be divided into seven distinct categories. Owing to the wide activity of the Mariner transposon, Tn-seq has the potential to contribute to the exploration of complex pathways across many different species.
Figures


Similar articles
-
Genome-Wide Fitness and Genetic Interactions Determined by Tn-seq, a High-Throughput Massively Parallel Sequencing Method for Microorganisms.Curr Protoc Mol Biol. 2014 Apr 14;106:7.16.1-7.16.24. doi: 10.1002/0471142727.mb0716s106. Curr Protoc Mol Biol. 2014. PMID: 24733243 Free PMC article. Review.
-
Genome-wide fitness and genetic interactions determined by Tn-seq, a high-throughput massively parallel sequencing method for microorganisms.Curr Protoc Microbiol. 2010 Nov;Chapter 1:Unit1E.3. doi: 10.1002/9780471729259.mc01e03s19. Curr Protoc Microbiol. 2010. PMID: 21053251 Free PMC article.
-
Genome-Wide Fitness and Genetic Interactions Determined by Tn-seq, a High-Throughput Massively Parallel Sequencing Method for Microorganisms.Curr Protoc Microbiol. 2015 Feb 2;36:1E.3.1-1E.3.24. doi: 10.1002/9780471729259.mc01e03s36. Curr Protoc Microbiol. 2015. PMID: 25641100 Free PMC article.
-
Protocols for Tn-seq Analyses in the Group A Streptococcus.Methods Mol Biol. 2020;2136:33-57. doi: 10.1007/978-1-0716-0467-0_4. Methods Mol Biol. 2020. PMID: 32430812
-
The bare necessities: Uncovering essential and condition-critical genes with transposon sequencing.Mol Oral Microbiol. 2019 Apr;34(2):39-50. doi: 10.1111/omi.12256. Epub 2019 Mar 1. Mol Oral Microbiol. 2019. PMID: 30739386 Review.
Cited by
-
A trans-translation inhibitor is potentiated by zinc and kills Mycobacterium tuberculosis and non-tuberculous mycobacteria.bioRxiv [Preprint]. 2024 Nov 2:2024.11.02.621434. doi: 10.1101/2024.11.02.621434. bioRxiv. 2024. PMID: 39554143 Free PMC article. Preprint.
-
The Evolution of Next-Generation Sequencing Technologies.Methods Mol Biol. 2025;2866:3-29. doi: 10.1007/978-1-0716-4192-7_1. Methods Mol Biol. 2025. PMID: 39546194 Review.
-
PIMMS-Dash: Accessible analysis, interrogation, and visualisation of high-throughput transposon insertion sequencing (TIS) data.Comput Struct Biotechnol J. 2024 Oct 18;23:3780-3783. doi: 10.1016/j.csbj.2024.10.025. eCollection 2024 Dec. Comput Struct Biotechnol J. 2024. PMID: 39525080 Free PMC article.
-
A simple and cost-effective transformation system for Porphyromonas gingivalis via natural competence.Front Microbiol. 2024 Oct 21;15:1476171. doi: 10.3389/fmicb.2024.1476171. eCollection 2024. Front Microbiol. 2024. PMID: 39498132 Free PMC article.
-
Essential Genes Discovery in Microorganisms by Transposon-Directed Sequencing (Tn-Seq): Experimental Approaches, Major Goals, and Future Perspectives.Int J Mol Sci. 2024 Oct 21;25(20):11298. doi: 10.3390/ijms252011298. Int J Mol Sci. 2024. PMID: 39457080 Free PMC article. Review.
References
-
- Pan X, Ye P, Yuan DS, et al. A DNA integrity network in the yeast Saccharomyces cerevisiae. Cell. 2006;124:1069–1081. - PubMed
-
- Tong AH, Evangelista M, Parsons AB, et al. Systematic genetic analysis with ordered arrays of yeast deletion mutants. Science. 2001;294:2364–2368. - PubMed
-
- Pan X, Yuan DS, Xiang D, et al. A Robust Toolkit for Functional Profiling of the Yeast Genome. Molecular Cell. 2004;16:487–496. - PubMed
-
- Schuldiner M, Collins S, Thompson N, et al. Exploration of the Function and Organization of the Yeast Early Secretory Pathway through an Epistatic Miniarray Profile. Cell. 2005;123:507–519. - PubMed
Publication types
MeSH terms
Substances
Grants and funding
LinkOut - more resources
Full Text Sources
Other Literature Sources
Research Materials


