iBet uBet web content aggregator. Adding the entire web to your favor.


Link to original content: https://pubmed.ncbi.nlm.nih.gov/19233853
Structural determinants of drugs acting on the Nav1.8 channel - PubMed Skip to main page content
U.S. flag

An official website of the United States government

Dot gov

The .gov means it’s official.
Federal government websites often end in .gov or .mil. Before sharing sensitive information, make sure you’re on a federal government site.

Https

The site is secure.
The https:// ensures that you are connecting to the official website and that any information you provide is encrypted and transmitted securely.

Access keys NCBI Homepage MyNCBI Homepage Main Content Main Navigation
. 2009 Apr 17;284(16):10523-36.
doi: 10.1074/jbc.M807569200. Epub 2009 Feb 19.

Structural determinants of drugs acting on the Nav1.8 channel

Affiliations

Structural determinants of drugs acting on the Nav1.8 channel

Liam E Browne et al. J Biol Chem. .

Abstract

The aim of this work is to study the role of pore residues on drug binding in the Na(V)1.8 channel. Alanine mutations were made in the S6 segments, chosen on the basis of their roles in other Na(V) subtypes; whole cell patch clamp recordings were made from mammalian ND7/23 cells. Mutations of some residues caused shifts in voltage dependence of activation and inactivation, and gave faster time course of inactivation, indicating that the residues mutated play important roles in both activation and inactivation in the Na(V)1.8 channel. The resting and inactivated state affinities of tetracaine for the channel were reduced by mutations I381A, F1710A, and Y1717A (for the latter only inactivated state affinity was measured), and by mutation F1710A for the Na(V)1.8-selective compound A-803467, showing the involvement of these residues for each compound, respectively. For both compounds, mutation L1410A caused the unexpected appearance of a complete resting block even at extremely low concentrations. Resting block of native channels by compound A-803467 could be partially removed ("disinhibition") by repetitive stimulation or by a test pulse after recovery from inactivation; the magnitude of the latter effect was increased for all the mutants studied. Tetracaine did not show this effect for native channels, but disinhibition was seen particularly for mutants L1410A and F1710A. The data suggest differing, but partially overlapping, areas of binding of A-803467 and tetracaine. Docking of the ligands into a three-dimensional model of the Na(V)1.8 channel gave interesting insight as to how the ligands may interact with pore residues.


Figures

FIGURE 1.
FIGURE 1.
A, the structures of the compounds tetracaine and A-803467. B, alignments of the S6 segments of different human NaV subtypes. The figure also summarizes results from this study. The residues indicated are shown in this study to be important for the affinity of tetracaine (T) and A-803467 (A) using mutagenesis, or tetracaine (t) and A-803467 (a) using computational modeling. The residues indicated (|) did not appear to be important for the binding of tetracaine or A-803467 by mutagenesis or by computational modeling.
FIGURE 2.
FIGURE 2.
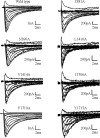
Example current traces for human NaV1.8 channels. Current traces are shown for ND7/23 cells transfected with wild type or mutant hNaV1.8 channel cDNA in the presence of 200 nm tetrodotoxin. Currents were elicited for voltage steps to -100 to +60 mV (in 10-mV increments) from a holding potential of -120 mV. The peak current amplitudes were -79 ± 7 pA/pF (n = 79) for wild type NaV1.8, -53 ± 5 pA/pF (n = 50) for mutant I381A, -112 ± 21 pA/pF (n = 52) for mutant N390A, -32 ± 5 pA/pF (n = 31) for mutant L1410A, -64 ± 6 pA/pF (n = 58) for mutant V1414A, -35 ± 4 pA/pF (n = 38) for mutant I1706A, -69 ± 7 pA/pF (n = 45) for mutant F1710A, and -40 ± 3 pA/pF (n = 54) for mutant Y1717A.
FIGURE 3.
FIGURE 3.
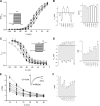
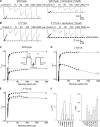
Effects of S6 mutations on Na+ channel activation and inactivation. A, conductance-voltage curves are shown for wild type NaV1.8 (▪, n = 79), and mutations I381A (•, n = 50), N390A (▴, n = 52), L1410A (▾, n = 31), V1414A (□, n = 58), I1706A (○, n = 38), F1710A (Δ, n = 45), and Y1717A (▿, n = 54). Curves were fit with the Boltzmann equation and normalized to maximum conductance. The pulse protocol is shown in the inset. B, bar diagrams show the voltage for half-maximal activation (V½) and the slope factor (k) for wild type and mutant channels (same experiments as in A). C, curves are shown for the voltage dependence of inactivation for wild type NaV1.8 (▪, n = 84), and mutations I381A (•, n = 13), N390A (▴, n = 14), L1410A (▾, n = 6), V1414A (□, n = 25), I1706A (○, n = 12), F1710A (Δ, n = 18), and Y1717A (▿, n = 14). The curves were fit with the Boltzmann equation and normalized to the maximum current. The pulse protocol is shown in the inset. D, bar diagrams (same experiments as C) showing the voltage for half-maximal inactivation (V½), and the amplitude of the non-inactivated component normalized to the maximum current (A/B, see “Experimental Procedures”). *, p < 0.05. E, the inset shows example currents for wild type and mutant (V1414A) NaV1.8 channels elicited by a voltage step to 0 mV from a holding potential of -120 mV. Current traces were normalized and superimposed. The time constant, τ, obtained from the inactivation time course is shown for wild type NaV1.8 (▪, n = 56), and mutations I381A (•, n = 35), N390A (▴, n = 34), L1410A (▾, n = 32), V1414A (□, n = 36), I1706A (○, n = 32), F1710A (Δ, n = 37), and Y1717A (▿, n = 38), for the test potentials shown. F, bar diagrams are shown for the mean values of the time constant of inactivation, τ, for each mutant at -10 mV test potential (same experiments as in E). *, p < 0.05.
FIGURE 4.
FIGURE 4.
Binding sites for tetracaine and A-803467 on the wild type NaV1.8 channel. The figure shows steady-state inactivation curves for (A) tetracaine (10 μm, ○, n = 4), (B) A-803467 (150 nm, ○, n = 4), and (C) tetracaine (5 μm) plus A-803467 (75 nm)(○, n = 8). Control curves in the absence of drug are shown (•, paired values in each case). The protocol used was as in Fig. 3C, and Boltzmann curves fit as before. The shifts in the inactivation curves (ΔV½) were determined and are shown in D. Predicted values of the shifts are shown for separate binding sites and for overlapping binding sites using the model of Kuo (37). Briefly, in this model, in the presence of a single drug of concentration ([D]), and affinity Ki, the shift is given by ΔV = k(ln(1 + ([D]/Ki))). For both drugs applied together, if the two drugs act on an overlapping site, the shift of the inactivation curve is given by ΔV = k(ln(1 + ([D1]/Ki1) + ([D2]/Ki2))), where [D1] and [D2] are the concentrations of each drug with the respective Ki values Ki1 and Ki2. In contrast, if the two drugs act on separate sites, then the shift in the inactivation curve is given by ΔV = k(ln(1 + ([D1]/Ki1) + ([D2]/Ki2) + ([D1]/Ki1)([D2]/Ki2))). For the predictions in D, values of Ki are as indicated in Fig. 5, and values of k for each drug application were obtained from the above inactivation curves, taking mean values in each case.
FIGURE 5.
FIGURE 5.
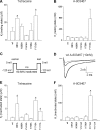
Dissociation constants for resting and inactivated states of mutant NaV1.8 channels. A, bar diagrams are shown representing mutant NaV1.8 channel resting state dissociation constants (Kr) for tetracaine. Values were calculated for tetracaine at 10 μm for wild type NaV1.8 (n = 6) and mutations I381A (n = 7), N390A (n = 8), V1414A (n = 5), I1706A (n = 6), and F1710A (n = 4). B, bar diagrams are shown representing resting state dissociation constants (Kr) for compound A-803467. Values were calculated for A-803467 at 100 nm for wild type NaV1.8 (n = 5) and mutations I381A (n = 4), N390A (n = 9), V1414A (n = 6), I1706A (n = 2), and F1710A (n = 7). It was not possible to determine the resting state dissociation constant for mutation Y1717A under the conditions used here, because a large proportion (23%) of channels are inactivated at a holding potential of -120 mV as a consequence of the strong negative shift in the inactivation curve. C, the figure shows the twin pulse protocol used to determine the inactivated state affinities (Ki). This was used before and after test compound application; the depicted 4-s depolarizing pulse was to potentials such that 60–80% inactivation was observed. In the case of mutant Y1717A, the resting level of inactivation at -120 mV (as above) was taken into account in obtaining the parameter h. D, the figure shows example current traces elicited by the pulse protocol in C, where currents in bold are before test compound application and fine traces are after test compound application; the currents larger in magnitude correspond to the control pulses and currents smaller in magnitude correspond to the test pulse following a 4-s depolarization. E, bar diagrams are shown representing mutant NaV1.8 channel-inactivated state dissociation constants (Ki) for tetracaine. Values were calculated for tetracaine at 1–10 μm for wild type NaV1.8 (n = 7) and mutations I381A (n = 6), N390A (n = 6), V1414A (n = 6), I1706A (n = 5), F1710A (n = 7), and Y1717A (n = 7). F, bar diagrams are shown representing mutant NaV1.8 channel-inactivated state dissociation constants (Ki) for compound A-803467. Values were calculated for A-803467 at 10–100 nm for wild type NaV1.8 (n = 7) and mutations I381A (n = 6), N390A (n = 7), V1414A (n = 5), I1706A (n = 6), F1710A (n = 7), and Y1717A (n = 7). *, p < 0.05.
FIGURE 6.
FIGURE 6.
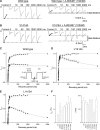
Disinhibition of resting block for mutation L1410A. A, the figure shows example L1410A mutant currents in the absence and presence of very low concentrations (indicated) of tetracaine and A-803467. The current traces were elicited by a test pulse to 0 mV from a holding potential of -120 mV. B, currents, Inorm, for mutant L1410A NaV1.8 channels are shown during a 10-Hz train of pulses (10-ms duration to 0 mV from a holding potential of -120 mV), plotted against pulse number and normalized to the first pulse of the untreated cell. The currents are shown before the application of tetracaine (▪, n = 6) or A-803467 (•, n = 8) and after tetracaine (10 nm, □) or A-803467 (100 pm, ○) in paired cells. C, as shown in the protocol, current amplitude was measured at a test pulse following a 600-ms depolarizing pulse to 0 mV and a 100-ms recovery period. D, the bar diagrams show the mean currents using the protocol in C, before (filled bars) and after (unfilled bars) the application of tetracaine (10 nm, n = 5) or compound A-803467 (100 pm, n = 6) in paired cells.
FIGURE 7.
FIGURE 7.
The effect of A-803467 on the recovery from inactivation. Example NaV1.8 channel currents are shown for wild type (A) and V1414A mutant (B) in the presence or absence of A-803467 (100 nm). Currents were elicited by an initial control pulse (to 0 mV), followed by test pulses (to 0 mV) at the indicated times during recovery (protocol shown in the inset of C). The graphs show the test pulse amplitude normalized to control pulse during the recovery from inactivation for wild type (C), and example mutations, V1414A (D) and L1410A (E), using the protocol shown in the inset. Time courses of recovery from inactivation are shown before (▪) and after (•) the application of A-803467 (100 nm, except 100 pm for L1410A) in paired cells. F, bar diagrams are shown for the amplitude (Idis, normalized to extent of resting current block) and time course (τ) of the slowest component of the three-exponential fit to the time course of recovery of inactivation for wild type (n = 5), and mutants I381A (n = 7), N390A (n = 7), L1410A (n = 5), V1414A (n = 6), I1706A (n = 2), and F1710A (n = 7). The dotted line in CE represents the level of resting block.
FIGURE 8.
FIGURE 8.
The effect of tetracaine on the recovery from inactivation. Example NaV1.8 channel currents are shown for wild type (A) and F1710A mutant (B) in the presence or absence of tetracaine (10 μm). Currents were elicited by an initial control pulse (to 0 mV), followed by test pulses (to 0 mV) at the indicated times during recovery (protocol shown in the inset of C). The graphs show the test pulse amplitude normalized to control pulse during the recovery from inactivation for wild type (C), and example mutations, L1410A (D) and F1710A (E), using the protocol shown in the inset. Time courses of recovery from inactivation are shown before (▪) and after (•) the application of tetracaine (10 μm, except 10 nm for L1410A) in paired cells. F, bar diagrams are shown for the amplitude (Idis, which is the disinihibitory component I3 expressed as a fraction of resting current block) and time course (τ) of the slowest component of the three-exponential fit to the time course of recovery of inactivation for mutants N390A (n = 4), L1410A (n = 7), V1414A (n = 3), I1706A (n = 3), F1710A (n = 4), and Y1717A (n = 6), whereas wild type (n = 6) and mutant I381A (n = 6) did not show disinhibition. The dotted line in C–E represents the level of resting block.
FIGURE 9.
FIGURE 9.
Sequence alignments used in the model. The S5 helices, P-loops, and S6 helices are aligned with the rat KV1.2 channel (31). The DEKA motif in the filter and the glycines in S6 are shown shaded.
FIGURE 10.
FIGURE 10.
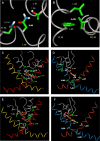
Modeling of the pore region of NaV1.8. A, local environment around Asn390, with hydrogen bonds between this residue and Asn1724 on S6 of domain IV and Thr250 on S5 of domain I. B, local environment around Val1414, with hydrophobic interactions with Leu889 and Phe893 on S6 of domain II. These interactions occur at the cytoplasmic side of the bundle in the open state model. C, the figure shows docking of tetracaine to IIS6, IVS6, and P-loops, with π-π stacking Phe1710 (in IVS6) and Tyr1717 (in IVS6), whereas the latter residue also forms a hydrogen bond with the ester carbonyl group of tetracaine. Hydrophobic interactions are also observed between tetracaine and Leu882 (in IIS6) and Leu1711 (IVS6). D, docking is shown for tetracaine to IS6, IIIS6, and P-loops, with the protonated amino group of the compound forming a salt bridge with Asp356 (in the P-loop), whereas the amino-methyl groups have hydrophobic interactions with Ile381 (in IS6) and Phe382 (in IS6). The butyl group of tetracaine also forms hydrophobic interactions with Leu1410 (in IIIS6) and Phe1413 (in IIIS6). E, docking of A-803467 is shown to IIS6, IVS6, and P-loops, with P-loop residues Thr354 and Ser1660 hydrogen bonding to the two methoxy groups of the compound. There is π-π stacking between the ligand and Phe1710 (in IVS6) and additional hydrophobic interaction with Leu882 (in IIS6) and Val1714 (in IVS6). F, the figure shows docking of A-803467 to IS6, IIIS6, and P-loops, with primary interaction with Asp356 (in the P-loop) and Leu1410 (in IIIS6) in the proximity of the chlorophenyl ring of the compound. There is also a hydrogen bond between the amide carbonyl group of the compound and Ser385 (in IS6). Residues Asn390 (in IS6) and Val1414 (in IIIS6) do not interact with the ligand. The figures in CF show P-loops for domains I and IV and S6 helices for all four domains. The α-carbon ribbons are color-coded as follows: gray, pore loops; blue, IS6; yellow, IIS6; orange, IIIS6; red, IVS6. The underlined residues were mutated.

Similar articles

Cited by

References

    1. Catterall, W. A., Goldin, A. L., and Waxman, S. G. (2005) Pharmacol. Rev. 57 397-409 - PubMed
    1. Hille, B. (2001) Ionic Channels of Excitable Membranes, Sinauer, Sunderland, MA
    1. Catterall, W. A. (2000) Neuron 26 13-25 - PubMed
    1. Yang, N., George, A. L., Jr., and Horn, R. (1996) Neuron 16 113-122 - PubMed
    1. Goldin, A. L., Barchi, R. L., Caldwell, J. H., Hofmann, F., Howe, J. R., Hunter, J. C., Kallen, R. G., Mandel, G., Meisler, M. H., Netter, Y. B., Noda, M., Tamkun, M. M., Waxman, S. G., Wood, J. N., and Catterall, W. A. (2000) Neuron 28 365-368 - PubMed

Publication types

MeSH terms

LinkOut - more resources