iBet uBet web content aggregator. Adding the entire web to your favor.


Link to original content: https://pubmed.ncbi.nlm.nih.gov/19206802/
A cocktail party with a cortical twist: how cortical mechanisms contribute to sound segregation - PubMed Skip to main page content
U.S. flag

An official website of the United States government

Dot gov

The .gov means it’s official.
Federal government websites often end in .gov or .mil. Before sharing sensitive information, make sure you’re on a federal government site.

Https

The site is secure.
The https:// ensures that you are connecting to the official website and that any information you provide is encrypted and transmitted securely.

Access keys NCBI Homepage MyNCBI Homepage Main Content Main Navigation
. 2008 Dec;124(6):3751-71.
doi: 10.1121/1.3001672.

A cocktail party with a cortical twist: how cortical mechanisms contribute to sound segregation

Affiliations

A cocktail party with a cortical twist: how cortical mechanisms contribute to sound segregation

Mounya Elhilali et al. J Acoust Soc Am. 2008 Dec.

Abstract

Sound systems and speech technologies can benefit greatly from a deeper understanding of how the auditory system, and particularly the auditory cortex, is able to parse complex acoustic scenes into meaningful auditory objects and streams under adverse conditions. In the current work, a biologically plausible model of this process is presented, where the role of cortical mechanisms in organizing complex auditory scenes is explored. The model consists of two stages: (i) a feature analysis stage that maps the acoustic input into a multidimensional cortical representation and (ii) an integrative stage that recursively builds up expectations of how streams evolve over time and reconciles its predictions with the incoming sensory input by sorting it into different clusters. This approach yields a robust computational scheme for speaker separation under conditions of speech or music interference. The model can also emulate the archetypal streaming percepts of tonal stimuli that have long been tested in human subjects. The implications of this model are discussed with respect to the physiological correlates of streaming in the cortex as well as the role of attention and other top-down influences in guiding sound organization.


Figures

Figure 1
Figure 1
Schematic of a model for auditory scene analysis. The computational model consists of two stages: a feature analysis stage, which maps the acoustic waveform into a multidimensional cortical representation, and an integrative and clustering stage, which segregates the cortical patterns into corresponding streams. The gray captions within each stage emphasize the principle outputs of the different modules. In the feature analysis stage, additional dimensions are added to the representation at each module, evolving from a 1D acoustic waveform (time) to a 2D auditory spectrogram (time-frequency) to a three-dimensional harmonicity mapping (time-frequency-pitch frequency) to a 4D multiscale cortical representation (time-frequency-pitch frequency-spectral shape). The integrative and clustering stage of the model is initiated by a clustering module which determines the stream that matches best the incoming feature vectors I(t). These vectors are then integrated by multirate cortical dynamics, which recursively update an estimate of the state of streams A and B via a Kalman-filter-based process. The cortical cluster use their current states to make a prediction of the expected inputs at time t+1: IA(t+1) and IB(t+1). The perceived streams are always available online as they evolve and take their final stable form.
Figure 2
Figure 2
Peripheral auditory processing. The schematic depicts the stages of early auditory processing starting from cochlear filtering, followed by hair-cell transduction, spectral and temporal sharpening, and onset enhancement. The output of this process is an onset-enhanced time-frequency auditory spectrogram.
Figure 3
Figure 3
Harmonicity analysis stage. The auditory spectrogram is further analyzed to extract any harmonically related spectral channels. The lower left panel in the figure depicts a mixture of male and female utterances shown in the lower panel. At time instant t0, a temporal cross section of the spectrogram P(x;to) is extracted and processed through a template matching model. The output of this template matching is shown in the top rightmost panel and reveals that the cross section P(x;to) yields a good match with a harmonic template at 104 Hz and another one at 227 Hz, corresponding to the male and female voices, respectively, at that time instant.
Figure 4
Figure 4
Cortical spectral shape analysis. Each spectral slice is further analyzed via a multiresolution wavelet analysis. The multiscale mapping highlights various features of the original spectrum, namely, the fundamental frequency F0 and its harmonic partials as well as its formant peaks (particularly the second and third formant frequencies F2 and F3).
Figure 5
Figure 5
Architecture of the feature integration and clustering processes. The schematic illustrates the various stages involved in segregated the acoustic patterns represented in the feature analysis stage. The incoming sensory inputs I(t) are compared to predicted patterns I^A(t) and I^B(t). The features which are most consistent with I^A(t) are “passed through” the stream A branch into a cortical integrative array. This neural cluster plays a dual role: it accumulates the information and outputs a representation of stream A (YA(t)) and it uses the available information (I(t),Y(t)) to update the current memory trace of stream A via a Kalman-filter estimation. This information is in turn used to build an expectation about the next input I^A(t+1), hence closing the feedback loop. The upper (yellow) panel indicates that a similar process takes place over a second cortical cluster (B), which tracks the evolution of another stream in the environment.
Figure 6
Figure 6
Induction of streaming with alternating two tone sequences. The model’s segregation of alternating two-tone sequences is tested with different stimulus parameters and averaged across 25 repetitions. The frequency separation and tone repetition time values tested are shown with the white diamond-shaped points. The surface shown in the figure is an interpolation of the results from these points using a cubic 2D interpolation. The white contour represents a contour of 25% to indicate a potential coherence boundary. The low tone in the sequence was fixed at 850 Hz, while the high note was placed, , , semitones higher. Each tone was 75 ms long.
Figure 7
Figure 7
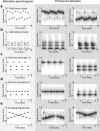
Model simulations of “classic” auditory scene analysis demonstrations. The left column of panels shows the acoustic stimuli fed to the model. The middle and right columns depict the results of the stream segregation process, which are defined as the time-frequency marginal obtained by integrating the time-frequency activity across the entire neural population (scale and rate filters) representing each cluster. (a) Multitone cycles: The stimulus consists of alternating a high sequence of 2500, 2000, and 1600 Hz notes and a low sequence of 350, 430, and 550 Hz (Bregman and Ahad, 1990). The frequency separation between the two sequences induces a perceptual split into two streams (middle and right panels). (b) Alternating vowels: Two natural ∕e∕ and ∕ə∕ vowels are presented in an alternating sequence at a rate of roughly 2 Hz. The vowels are produced by a male speaker with an average pitch of 110 Hz. Timbre differences (or different spectral shapes) cause the vowel outputs to segregate into separate streams. (c) Old+new principle (1): An alternating sequence of a high A note (1800 Hz) and BC complex (650 and 300 Hz) is presented to the model. The tone complex BC is strongly glued together by virtue of common onset cues, and hence segregates from the A sequence which activates a separate frequency region. (d) Old+new principle (2): The same design as in simulation (c) is tested again with a new note A frequency at 650 Hz. Since tones A and B activated the same frequency channel, they are now grouped as a perceptual stream separate from stream C (gray panels), following the continuity principle. (e) Crossing trajectories: A rising sequence (from 400 to 1600 Hz in seven equal log-frequency steps) is interleaved with a falling sequence of similar note values in reverse (Bregman and Ahad, 1990).
Figure 8
Figure 8
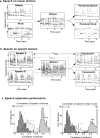
Model performance with real speech mixtures. (a) Speech-on-music mixtures: Left panels depict spectrograms of a male utterance and a piano melody. The mixture of these two waveforms is shown in the middle. Model outputs segregate the two sources into two streams that resemble the original clean spectrograms (derived as time-frequency marginals similar to Fig. 7). (b) Speech-on-speech mixtures: Male and female speech are mixed and fed into the model, which segregates them into two streams. To evaluate performance, correlation coefficients (ρ) are computed as indicators of the match between the original and recovered spectrograms: ρseg measures the similarity between the original and streamed speech of the same speaker. ρbase measures the (baseline) similarity between the two original speakers. ρconf measures the confusions between an original speaker and the other competing speaker. (c) Speech segregation performance is evaluated by the distribution of the three correlation coefficients. Left panel illustrates that the average values of ρseg=0.81 are well above those of ρconf=0.4 and ρbase=0.2, indicating that the segregated streams match the originals reasonably well, but that some interference remains. Right panel illustrates results from the model bypassing the harmonic analysis stage (see text for details). The improved separation between the distributions demonstrates the remarkable effectiveness of the integrative and clustering stage of the model when harmonic interference is completely removed (distribution means ρseg=0.9, ρconf=0.3, and ρbase=0.2).
Figure 9
Figure 9
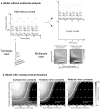
Model performance after modification of parameters. (a) Omitting the multiscale analysis: The model (without the scale analysis) is simulated using alternating vowels ∕e∕ and ∕ə∕ [shown in Fig. 7b]. A time-frequency spectrogram is presented to the incomplete model and leads to the entire stream being grouped as one cluster (shown above) and an empty second cluster. The two top rightmost panels depict the time-frequency marginals reflecting the energy in each cluster. Below: A tonotopic view of the two vowels (obtained from two cross sections of the spectrogram at different time instances) reveals a great overlap in the spectral region occupied by both phonemes. The right panels show a multiscale view of both phonemes and reveal the different timbre structures that emerge from the multiple scale filters. (b) Varying the cortical dynamics: The three panels show results of segregation of alternating two tones with varying dynamic ranges for the cortical filters. The white contours are all boundaries reflecting a 25% threshold of streaming. The leftmost panel is a replica of Fig. 6.

Similar articles

Cited by

References

    1. Anstis, S., and Saida, S. (1985). “Adaptation to auditory streaming of frequency-modulated tones,” J. Exp. Psychol. Hum. Percept. Perform. JPHPDH10.1037//0096-1523.11.3.257 11, 257–271. - DOI
    1. Aubin, T., and Jouventin, P. (1998). “Cocktail-part effect in king penguin colonies,” Proc. R. Soc. London, Ser. B PRLBA410.1098/rspb.1998.0486 265, 1665–1673. - DOI
    1. Barlow, H. (1994). Large-Scale Neuronal Theories of the Brain (MIT Press, Cambridge, MA: ), pp. 1–22.
    1. Bay, J. S. (1999). Fundamentals of Linear State Space Systems (McGraw-Hill, Boston: ).
    1. Beauvois, M. W., and Meddis, R. (1996). “Computer simulation of auditory stream segregation in alternating-tone sequences,” J. Acoust. Soc. Am. JASMAN10.1121/1.415414 99, 2270–2280. - DOI - PubMed

Publication types