Plaque and tangle imaging and cognition in normal aging and Alzheimer's disease
- PMID: 19004525
- PMCID: PMC2891885
- DOI: 10.1016/j.neurobiolaging.2008.09.012
Plaque and tangle imaging and cognition in normal aging and Alzheimer's disease
Abstract
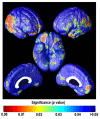
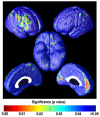
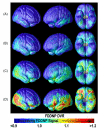
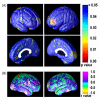
Amyloid plaques and tau neurofibrillary tangles, the pathological hallmarks of Alzheimer's disease (AD), begin accumulating in the healthy human brain decades before clinical dementia symptoms can be detected. There is great interest in how this pathology spreads in the living brain and its association with cognitive deterioration. Using MRI-derived cortical surface models and four-dimensional animation techniques, we related cognitive ability to positron emission tomography (PET) signal from 2-(1-{6-[(2-[F-18]fluoroethyl)(methyl)amino]-2-naphthyl}ethylidene)malononitrile ([(18)F]FDDNP), a molecular imaging probe for plaques and tangles. We examined this relationship at each cortical surface point in 23 older adults (10 cognitively intact, 6 with amnestic mild cognitive impairment, 7 with AD). [(18)F]FDDNP-PET signal was highly correlated with cognitive performance, even in cognitively intact subjects. Animations of [(18)F]FDDNP signal growth with decreased cognition across all subjects (http://www.loni.ucla.edu/ approximately thompson/FDDNP/video.html) mirrored the classic Braak and Braak trajectory in lateral temporal, parietal, and frontal cortices. Regions in which cognitive performance was significantly correlated with [(18)F]FDDNP signal include those that deteriorate earliest in AD, suggesting the potential utility of [(18)F]FDDNP for early diagnosis.
(c) 2008 Elsevier Inc. All rights reserved.
Figures


Similar articles
-
Influence of cognitive status, age, and APOE-4 genetic risk on brain FDDNP positron-emission tomography imaging in persons without dementia.Arch Gen Psychiatry. 2009 Jan;66(1):81-7. doi: 10.1001/archgenpsychiatry.2008.516. Arch Gen Psychiatry. 2009. PMID: 19124691 Free PMC article.
-
Voxel-based analysis of Alzheimer's disease PET imaging using a triplet of radiotracers: PIB, FDDNP, and FDG.Neuroimage. 2010 Aug 15;52(2):488-96. doi: 10.1016/j.neuroimage.2010.04.013. Epub 2010 Apr 10. Neuroimage. 2010. PMID: 20385246
-
PET of brain amyloid and tau in mild cognitive impairment.N Engl J Med. 2006 Dec 21;355(25):2652-63. doi: 10.1056/NEJMoa054625. N Engl J Med. 2006. PMID: 17182990
-
The merits of FDDNP-PET imaging in Alzheimer's disease.J Alzheimers Dis. 2011;26 Suppl 3:135-45. doi: 10.3233/JAD-2011-0008. J Alzheimers Dis. 2011. PMID: 21971458 Review.
-
Visualizing pathology deposits in the living brain of patients with Alzheimer's disease.Methods Enzymol. 2006;412:144-60. doi: 10.1016/S0076-6879(06)12010-8. Methods Enzymol. 2006. PMID: 17046657 Review.
Cited by
-
Resting-State Network Alterations Differ between Alzheimer's Disease Atrophy Subtypes.Cereb Cortex. 2021 Oct 1;31(11):4901-4915. doi: 10.1093/cercor/bhab130. Cereb Cortex. 2021. PMID: 34080613 Free PMC article.
-
Neuroimaging Biomarkers of Chronic Traumatic Encephalopathy: Targets for the Academic Memory Disorders Clinic.Neurotherapeutics. 2021 Apr;18(2):772-791. doi: 10.1007/s13311-021-01028-3. Epub 2021 Apr 13. Neurotherapeutics. 2021. PMID: 33847906 Free PMC article. Review.
-
Neuroimaging Advances in Diagnosis and Differentiation of HIV, Comorbidities, and Aging in the cART Era.Curr Top Behav Neurosci. 2021;50:105-143. doi: 10.1007/7854_2021_221. Curr Top Behav Neurosci. 2021. PMID: 33782916
-
Role of Insulin in Neurotrauma and Neurodegeneration: A Review.Front Neurosci. 2020 Sep 23;14:547175. doi: 10.3389/fnins.2020.547175. eCollection 2020. Front Neurosci. 2020. PMID: 33100956 Free PMC article. Review.
-
White matter hyperintensities and their relationship to cognition: Effects of segmentation algorithm.Neuroimage. 2020 Feb 1;206:116327. doi: 10.1016/j.neuroimage.2019.116327. Epub 2019 Nov 1. Neuroimage. 2020. PMID: 31682983 Free PMC article.
References
-
- Agdeppa ED, Kepe V, Liu J, Flores-Torres S, Satyamurthy N, Petric A, Cole GM, Small GW, Huang SC, Barrio JR. Binding characteristics of radiofluorinated 6-dialkylamino-2-naphthylethylidene derivatives as positron emission tomography imaging probes for beta-amyloid plaques in Alzheimer’s disease. J. Neurosci. 2001a;21:RC189. - PMC - PubMed
-
- Agdeppa ED, Kepe V, Shoghi-Jadid K, Satyamurthy N, Small GW, Petric A, Vinters HV, Huang S-C, Barrio JR. In vivo and in vitro labeling of plaques and tangles in the brain of an Alzheimer’s disease patient: a case study. Ann. Meet. J. Nuclear Med. 2001b;42(Suppl 1):65P.
-
- American Psychological Association . Diagnosis and Statistical Manual of Mental Disorders DSM-IV-TR (Text Revision) Washington, DC: 2000.
-
- Apostolova LG, Lu PH, Rogers S, Dutton RA, Hayashi KM, Toga AW, Cummings JL, Thompson PM. 3D mapping of mini-mental state examination performance in clinical and preclinical Alzheimer disease. Alzheimer Dis. Assoc. Disord. 2006;20:224–231. - PubMed
-
- Berg L, McKeel DW, Jr., Miller JP, Storandt M, Rubin EH, Morris JC, Baty J, Coats M, Norton J, Goate AM, Price JL, Gearing M, Mirra SS, Saunders AM. Clinicopathologic studies in cognitively healthy aging and Alzheimer’s disease: relation of histologic markers to dementia severity, age, sex, and apolipoprotein E genotype. Arch. Neurol. 1998;55:326–335. - PubMed
MeSH terms
Substances
Grants and funding
- M01 RR000865-30/RR/NCRR NIH HHS/United States
- P30 AG010123-08S19002/AG/NIA NIH HHS/United States
- R01 LM005639-10/LM/NLM NIH HHS/United States
- M01 RR000865/RR/NCRR NIH HHS/United States
- P30 AG010123/AG/NIA NIH HHS/United States
- R01 AG013308/AG/NIA NIH HHS/United States
- R01 MH052453/MH/NIMH NIH HHS/United States
- R01 AG013308-13/AG/NIA NIH HHS/United States
- R01 HD050735/HD/NICHD NIH HHS/United States
- U54 RR021813-05/RR/NCRR NIH HHS/United States
- P41 RR013642/RR/NCRR NIH HHS/United States
- R01 MH058156/MH/NIMH NIH HHS/United States
- R21 RR019771-02/RR/NCRR NIH HHS/United States
- R01 MH097268/MH/NIMH NIH HHS/United States
- R01 MH052453-05/MH/NIMH NIH HHS/United States
- R21 DA024831/DA/NIDA NIH HHS/United States
- P50 AG016570-10/AG/NIA NIH HHS/United States
- R01 HD050735-02/HD/NICHD NIH HHS/United States
- R21 RR019771/RR/NCRR NIH HHS/United States
- R01 LM005639/LM/NLM NIH HHS/United States
- P50 AG016570/AG/NIA NIH HHS/United States
- R21 DA024831-01A1/DA/NIDA NIH HHS/United States
- R01 MH058156-05/MH/NIMH NIH HHS/United States
- U54 RR021813/RR/NCRR NIH HHS/United States
- P50 AG016570-100004/AG/NIA NIH HHS/United States
- F31 NS045425/NS/NINDS NIH HHS/United States
LinkOut - more resources
Full Text Sources
Other Literature Sources
Medical


