iBet uBet web content aggregator. Adding the entire web to your favor.


Link to original content: https://pubmed.ncbi.nlm.nih.gov/19002191/
Why do many psychiatric disorders emerge during adolescence? - PubMed Skip to main page content
U.S. flag

An official website of the United States government

Dot gov

The .gov means it’s official.
Federal government websites often end in .gov or .mil. Before sharing sensitive information, make sure you’re on a federal government site.

Https

The site is secure.
The https:// ensures that you are connecting to the official website and that any information you provide is encrypted and transmitted securely.

Access keys NCBI Homepage MyNCBI Homepage Main Content Main Navigation
Review
. 2008 Dec;9(12):947-57.
doi: 10.1038/nrn2513. Epub 2008 Nov 12.

Why do many psychiatric disorders emerge during adolescence?

Affiliations
Review

Why do many psychiatric disorders emerge during adolescence?

Tomás Paus et al. Nat Rev Neurosci. 2008 Dec.

Abstract

The peak age of onset for many psychiatric disorders is adolescence, a time of remarkable physical and behavioural changes. The processes in the brain that underlie these behavioural changes have been the subject of recent investigations. What do we know about the maturation of the human brain during adolescence? Do structural changes in the cerebral cortex reflect synaptic pruning? Are increases in white-matter volume driven by myelination? Is the adolescent brain more or less sensitive to reward? Finding answers to these questions might enable us to further our understanding of mental health during adolescence.


Figures
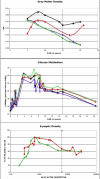
Figure 1
Figure 1
Schematic representations of developmental trajectories in local volume of cortical grey-matter (A), glucose metabolism (B) and synaptic density (C). Plots of grey matter are based on data by Gogtay et al and illustrate local grey-matter volume in the mid-dorsolateral prefrontal cortex in red (plot E in Fig. 1 of the original report), angular gyrus of the parietal cortex in black (plot I), posterior STS of the temporal cortex in purple (plot N), and the occipital pole in green (plot K). Plots of glucose metabolism are based on data by Chugani et al and provide information about the absolute values of local cerebral metabolic rate for glucose (LCMRglc) in the frontal (red), parietal (black), temporal (purple) and occipital (green) cortex. Plots of synaptic density are based on data by Huttenlocher and de Courten and Huttenlocher, as re-plotted on semi-logarithmic scale by Rakic et al (Fig. 4 in their report), and provide information about synaptic density in the prefrontal (red) and the striate (green) cortex. Note the following features of the above trajectories, especially between childhood and adulthood. To facilitate the comparison across the different plots, a vertical line was drawn at the age of 15 years. For cortical grey matter, different trajectories are observed in different cortical regions ((A). For glucose metabolism, the same trajectories are found in the four different lobes (B). This is also the case for the trajectories in synaptic density in the prefrontal and occipital cortex (C). Taken together, it is unlikely that a direct relationship exists between the three sets of measures.
Figure 2
Figure 2
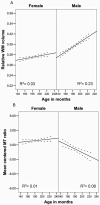
Sexual dimorphism in the maturation of white matter during adolescence. Top panel (A) illustrates age-related changes in the relative (brain-size corrected) volume of white matter summed across the frontal, parietal, temporal and occipital lobes. Bottom panel (B) illustrates age-related changes in mean-centered values of magnetization-transfer ratio (MTR) in the lobar white-matter; MTR provides an indirect index of myelination. The plots are based on data obtained by Perrin et al. Note that the opposite developmental trajectories in the volume and MTR suggest that age-related increases in white matter during male adolescence are not driven by myelination. See the original report for further information about the relationship between white matter and testosterone in male adolescents with different variants of androgen-receptor gene.
Figure 3
Figure 3
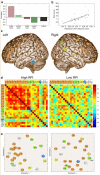
Functional connectivity, indexed by inter-regional correlations in fMRI signal, during the observation of angry hand movements in children differing in their resistance to peer influences. a, Latent Variable 1 (LV1) identified a combination of brain regions that, as a whole, correlated with the Resistance-to-Peer-Influence (RPI) scores. Note that high correlations are observed only for fMRI signal measured during the observation of Angry Hand Movements. b, Brains scores (weighted sum of all voxels in an image for each subject, using the weights derived from the brain LV1) derived from the fMRI signal measured during Angry Hand Movements plotted as a function of RPI. c, Locations of brain regions identified by LV1; only regions visible on the lateral surface of the left and right hemispheres are shown. d, Correlation matrices depicting inter-regional correlations of fMRI signal measured during the observation of Angry Hand Movements, as revealed by LV1, in subjects with High (left) and Low (right) Resistance to Peer Influence. The High and Low RPI subgroups correspond to the subjects with RPI scores above and below the group median, respectively. e, Multidimensional scaling (MDS) representations of the inter-regional correlations of the 26-D matrix depicted above; in the MDS 2-D plots, strongly correlated regions are placed close together. Note, for example, the close grouping of premotor (F03 and F04) and prefrontal (F08 and F09) fronto-cortical regions. F01, Premotor cortex, dorsal, left; F02, Premotor cortex, dorsal, right; F03, Premotor cortex, ventral, left; F04, Premotor cortex, ventral, right; F05, Frontal operculum, right; F06, Cingulate motor area, left; F07 Insula, anterior, left; F08, Prefrontal cortex, ventro-lateral, right; F09, Prefrontal cortex, dorso-lateral, left; F10, Prefrontal cortex, dorso-lateral, right; F11, Prefrontal cortex, ventro-lateral, left; F12, Anterior cingulate cortex, right; F13, Orbito-frontal cortex, lateral, left; F14, Prefrontal cortex, medial; P01, Posterior cingulate cortex; P02, Precuneus, left; P03, Parietal cortex, dorso-lateral, right; P04, Parietal cortex, dorso-medial, right; T01, Superior Temporal Sulcus, middle, right; T02, Superior Temporal Sulcus, posterior, right; T03, Hippocampus, right; O01, Fusiform gyrus, left; CN, Caudate nucleus, right; CB1, Cerebellum, right; CB2, Cerebellum, right; SC, Superior Colliculus, right. Reprinted with permission from Grosbras et al..
Figure 4
Figure 4
Ranges of onset age for common psychiatric disorders. Recent data from the National Comorbidity Survey Replication study, , a nationally representative epidemiological survey of mental disorders, suggest that about half of the population fulfill criteria for one or other psychiatric disorders in their lifetimes. The majority of those with a mental disorder have had the beginnings of the illness in childhood or adolescence. Some anxiety disorders such as phobias and separation anxiety and impulse-control disorders begin in childhood, while other anxiety disorders such as panic, generalized anxiety and post-traumatic stress disorder, substance disorders and mood disorders begin later, with onsets rarely before early teens. Schizophrenia typically begins in late adolescence or the early twenties, with men having a somewhat earlier age of onset compared to women. Psychiatric disorders with childhood or adolescent onsets tend to be more severe, are frequently undetected early in the illness, and accrue additional co-morbid disorders especially if untreated. It is therefore critical to focus efforts on early identification and intervention.

Similar articles

Cited by

References

    1. Bushong S. Magnetic resonance imaging. 3rd ed Mosby Inc.; 2003.
    1. Roberts TP, Mikulis D. Neuro MR: principles. J Magn Reson Imaging. 2007 Oct;26(4):823–837. - PubMed
    1. Keshavan MS, Kapur S, Pettegrew JW. Magnetic resonance spectroscopy in psychiatry: Potential, pitfalls and promise. The American journal of psychiatry. 1991;148(8):976–985. - PubMed
    1. Logothetis NK, Pauls J, Augath M, Trinath T, Oeltermann A. Neurophysiological investigation of the basis of the fMRI signal. Nature. 2001 Jul 12;412(6843):150–157. - PubMed
    1. Lenroot RK, Giedd JN. Brain development in children and adolescents: insights from anatomical magnetic resonance imaging. Neuroscience and biobehavioral reviews. 2006;30(6):718–729. - PubMed

Publication types