Phosphorylation and ankyrin-G binding of the C-terminal domain regulate targeting and function of the ammonium transporter RhBG
- PMID: 18635543
- PMCID: PMC3258915
- DOI: 10.1074/jbc.M803120200
Phosphorylation and ankyrin-G binding of the C-terminal domain regulate targeting and function of the ammonium transporter RhBG
Abstract
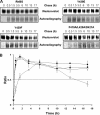
RhBG, a human member of the Amt/Mep/Rh/superfamily of ammonium transporters, has been shown to facilitate NH(3) transport and to be anchored to the basolateral plasma membrane of kidney epithelial cells, via ankyrin-G. We showed here that triple alanine substitution of the (419)FLD(421) sequence, which links the cytoplasmic C-terminal domain of RhBG to ankyrin-G, not only disrupted the interaction of RhBG with the spectrin-based skeleton but also delayed its cell surface expression, decreased its plasma membrane stability, and abolished its NH(3) transport function in epithelial cell lines. Similarly, we demonstrated that both anchoring to the membrane skeleton and ammonium transport activity are regulated by the phosphorylation status of the C-terminal tail of RhBG. Tyrosine 429, which belongs to the previously reported YED basolateral targeting signal of RhBG, was demonstrated to be phosphorylated in vitro using purified Src and Syk kinases and ex vivo by analyzing the effect of pervanadate treatment on wild-type RhBG or Y429A mutants. Then, we showed that Y429D and Y429E mutations, mimicking constitutive phosphorylation, abolished NH(3) transport and enhanced Triton X-100 solubilization of RhBG from the cell membrane. In contrast, the nonphosphorylated/nonphosphorylatable Y429A and Y429F mutants behaved the same as wild-type RhBG. Conversely, Y/A or Y/F but not Y/E or Y/D mutations of residue 429 abolished the exclusive basolateral localization of RhBG in polarized epithelial cells. All these results led to a model in which targeting and ammonium transport function of RhBG are regulated by both phosphorylation and membrane skeleton binding of the C-terminal cytoplasmic domain.
Figures


Similar articles
-
The ammonium transporter RhBG: requirement of a tyrosine-based signal and ankyrin-G for basolateral targeting and membrane anchorage in polarized kidney epithelial cells.J Biol Chem. 2005 Mar 4;280(9):8221-8. doi: 10.1074/jbc.M413351200. Epub 2004 Dec 17. J Biol Chem. 2005. PMID: 15611082
-
Evidence of a structural and functional ammonium transporter RhBG·anion exchanger 1·ankyrin-G complex in kidney epithelial cells.J Biol Chem. 2015 Mar 13;290(11):6925-36. doi: 10.1074/jbc.M114.610048. Epub 2015 Jan 23. J Biol Chem. 2015. PMID: 25616663 Free PMC article.
-
Expression of the gas-transporting proteins, Rh B glycoprotein and Rh C glycoprotein, in the murine lung.Am J Physiol Lung Cell Mol Physiol. 2009 Jul;297(1):L153-63. doi: 10.1152/ajplung.90524.2008. Epub 2009 May 8. Am J Physiol Lung Cell Mol Physiol. 2009. PMID: 19429772 Free PMC article.
-
Functional interaction between Rh proteins and the spectrin-based skeleton in erythroid and epithelial cells.Transfus Clin Biol. 2006 Mar-Apr;13(1-2):23-8. doi: 10.1016/j.tracli.2006.02.019. Epub 2006 Apr 3. Transfus Clin Biol. 2006. PMID: 16580865 Review.
-
Ammonia transport in the kidney by Rhesus glycoproteins.Am J Physiol Renal Physiol. 2014 May 15;306(10):F1107-20. doi: 10.1152/ajprenal.00013.2014. Epub 2014 Mar 19. Am J Physiol Renal Physiol. 2014. PMID: 24647713 Free PMC article. Review.
Cited by
-
Chloride Gradient Is Involved in Ammonium Influx in Human Erythrocytes.Int J Mol Sci. 2024 Jul 5;25(13):7390. doi: 10.3390/ijms25137390. Int J Mol Sci. 2024. PMID: 39000500 Free PMC article.
-
Pleiotropic Ankyrins: Scaffolds for Ion Channels and Transporters.Channels (Austin). 2022 Dec;16(1):216-229. doi: 10.1080/19336950.2022.2120467. Channels (Austin). 2022. PMID: 36082411 Free PMC article. Review.
-
Roles and mechanisms of ankyrin-G in neuropsychiatric disorders.Exp Mol Med. 2022 Jul;54(7):867-877. doi: 10.1038/s12276-022-00798-w. Epub 2022 Jul 6. Exp Mol Med. 2022. PMID: 35794211 Free PMC article. Review.
-
The ammonia transporter RhCG modulates urinary acidification by interacting with the vacuolar proton-ATPases in renal intercalated cells.Kidney Int. 2018 Feb;93(2):390-402. doi: 10.1016/j.kint.2017.07.027. Epub 2017 Oct 18. Kidney Int. 2018. PMID: 29054531 Free PMC article.
-
Ammonia Transporters and Their Role in Acid-Base Balance.Physiol Rev. 2017 Apr;97(2):465-494. doi: 10.1152/physrev.00011.2016. Physiol Rev. 2017. PMID: 28151423 Free PMC article. Review.
References
-
- Huang, C. H., and Liu, P. Z. (2001) Blood Cells Mol. Dis. 2790 -101 - PubMed
-
- Avent, N. D., and Reid, M. E. (2000) Blood 95375 -387 - PubMed
-
- Cartron, J. P. (1999) Baillieres Best Pract. Res. Clin. Haematol. 12655 -689 - PubMed
-
- Van Kim, C. L., Colin, Y., and Cartron, J. P. (2006) Blood Rev. 2093 -110 - PubMed
-
- Handlogten, M. E., Hong, S. P., Zhang, L., Vander, A. W., Steinbaum, M. L., Campbell-Thompson, M., and Weiner, I. D. (2005) Am. J. Physiol. 288G1036 -G1047 - PubMed
Publication types
MeSH terms
Substances
LinkOut - more resources
Full Text Sources
Molecular Biology Databases
Miscellaneous


