Density-dependent diversification in North American wood warblers
- PMID: 18611849
- PMCID: PMC2603228
- DOI: 10.1098/rspb.2008.0630
Density-dependent diversification in North American wood warblers
Abstract
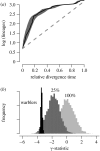
Evidence from both molecular phylogenies and the fossil record suggests that rates of species diversification often decline through time during evolutionary radiations. One proposed explanation for this pattern is ecological opportunity, whereby an initial abundance of resources and lack of potential competitors facilitate rapid diversification. This model predicts density-dependent declines in diversification rates, but has not been formally tested in any species-level radiation. Here we develop a new conceptual framework that distinguishes density dependence from alternative processes that also produce temporally declining diversification, and we demonstrate this approach using a new phylogeny of North American Dendroica wood warblers. We show that explosive lineage accumulation early in the history of this avian radiation is best explained by a density-dependent diversification process. Our results suggest that the tempo of wood warbler diversification was mediated by ecological interactions among species and that lineage and ecological diversification in this group are coupled, as predicted under the ecological opportunity model.
Figures


Comment in
-
Problems detecting density-dependent diversification on phylogenies.Proc Biol Sci. 2009 Mar 22;276(1659):993-4; discussion 995-7. doi: 10.1098/rspb.2008.1249. Proc Biol Sci. 2009. PMID: 19129112 Free PMC article. No abstract available.
Similar articles
-
Explosive evolutionary radiations: decreasing speciation or increasing extinction through time?Evolution. 2008 Aug;62(8):1866-75. doi: 10.1111/j.1558-5646.2008.00409.x. Epub 2008 Apr 29. Evolution. 2008. PMID: 18452577
-
A comprehensive multilocus phylogeny for the wood-warblers and a revised classification of the Parulidae (Aves).Mol Phylogenet Evol. 2010 Nov;57(2):753-70. doi: 10.1016/j.ympev.2010.07.018. Epub 2010 Aug 7. Mol Phylogenet Evol. 2010. PMID: 20696258
-
A late burst of colour evolution in a radiation of songbirds (Passeriformes: Parulidae) suggests secondary contact drives signal divergence.J Evol Biol. 2024 Apr 14;37(4):401-413. doi: 10.1093/jeb/voae023. J Evol Biol. 2024. PMID: 38373243
-
Adaptive radiation versus 'radiation' and 'explosive diversification': why conceptual distinctions are fundamental to understanding evolution.New Phytol. 2015 Jul;207(2):297-303. doi: 10.1111/nph.13482. Epub 2015 Jun 1. New Phytol. 2015. PMID: 26032979 Review.
-
Process and pattern in cichlid radiations - inferences for understanding unusually high rates of evolutionary diversification.New Phytol. 2015 Jul;207(2):304-312. doi: 10.1111/nph.13450. Epub 2015 May 13. New Phytol. 2015. PMID: 25983053 Review.
Cited by
-
Diversity-dependent speciation and extinction in hominins.Nat Ecol Evol. 2024 Jun;8(6):1180-1190. doi: 10.1038/s41559-024-02390-z. Epub 2024 Apr 17. Nat Ecol Evol. 2024. PMID: 38632435 Free PMC article.
-
Clade density and the evolution of diversity-dependent diversification.Nat Commun. 2023 Jul 29;14(1):4576. doi: 10.1038/s41467-023-39629-5. Nat Commun. 2023. PMID: 37516766 Free PMC article.
-
The build-up of the present-day tropical diversity of tetrapods.Proc Natl Acad Sci U S A. 2023 May 16;120(20):e2220672120. doi: 10.1073/pnas.2220672120. Epub 2023 May 9. Proc Natl Acad Sci U S A. 2023. PMID: 37159475 Free PMC article.
-
Is species richness mediated by functional and genetic divergence? A global analysis in birds.Funct Ecol. 2023 Jan;37(1):125-138. doi: 10.1111/1365-2435.14153. Epub 2022 Aug 9. Funct Ecol. 2023. PMID: 37064506 Free PMC article.
-
Diversification dynamics in Caribbean rain frogs (Eleutherodactylus) are uncoupled from the anuran community and consistent with adaptive radiation.Proc Biol Sci. 2023 Jan 11;290(1990):20222171. doi: 10.1098/rspb.2022.2171. Epub 2023 Jan 11. Proc Biol Sci. 2023. PMID: 36629104 Free PMC article.
References
-
- Baldwin B.G, Sanderson M.J. Age and rate of diversification of the Hawaiian silversword alliance (Compositae) Proc. Natl Acad. Sci. USA. 1998;95:9402–9406. doi:10.1073/pnas.95.16.9402 - DOI - PMC - PubMed
-
- Barraclough T.G, Vogler A.P. Recent diversification rates in North American tiger beetles estimated from a dated mtDNA phylogenetic tree. Mol. Biol. Evol. 2002;19:1706–1716. - PubMed
-
- Barraclough T.G, Hogan J.E, Vogler A.P. Testing whether ecological factors promote cladogenesis in a group of tiger beetles (Coleoptera: Cicindelidae) Proc. R. Soc. B. 1999;266:1061–1067. doi:10.1098/rspb.1999.0744 - DOI
-
- Bernatchez L, Chouinard A, Lu G. Integrating molecular genetics and ecology in studies of adaptive radiation: whitefish, Coregonus sp., as a case study. Biol. J. Linn. Soc. 1999;68:173–194.
-
- Cardillo M, Huxtable J.S, Bromham L. Geographic range size, life history and rates of diversification in Australian mammals. J. Evol. Biol. 2003;16:282–288. doi:10.1046/j.1420-9101.2003.00513.x - DOI - PubMed
Publication types
MeSH terms
Substances
LinkOut - more resources
Full Text Sources


