Inactivation as a new regulatory mechanism for neuronal Kv7 channels
- PMID: 17237198
- PMCID: PMC1831682
- DOI: 10.1529/biophysj.106.101287
Inactivation as a new regulatory mechanism for neuronal Kv7 channels
Abstract
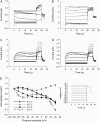
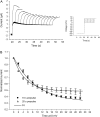
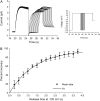
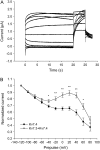
Voltage-gated K(+) channels of the Kv7 (KCNQ) family have important physiological functions in both excitable and nonexcitable tissue. The family encompasses five genes encoding the channel subunits Kv7.1-5. Kv7.1 is found in epithelial and cardiac tissue. Kv7.2-5 channels are predominantly neuronal channels and are important for controlling excitability. Kv7.1 channels have been considered the only Kv7 channels to undergo inactivation upon depolarization. However, here we demonstrate that inactivation is also an intrinsic property of Kv7.4 and Kv7.5 channels, which inactivate to a larger extent than Kv7.1 channels at all potentials. We demonstrate that at least 30% of these channels are inactivated at physiologically relevant potentials. The onset of inactivation is voltage dependent and occurs on the order of seconds. Both time- and voltage-dependent recovery from inactivation was investigated for Kv7.4 channels. A time constant of 1.47 +/- 0.21 s and a voltage constant of 54.9 +/- 3.4 mV were determined. It was further demonstrated that heteromeric Kv7.3/Kv7.4 channels had inactivation properties different from homomeric Kv7.4 channels. Finally, the Kv7 channel activator BMS-204352 was in contrast to retigabine found to abolish inactivation of Kv7.4. In conclusion, this work demonstrates that inactivation is a key regulatory mechanism of Kv7.4 and Kv7.5 channels.
Figures


Similar articles
-
The acrylamide (S)-2 as a positive and negative modulator of Kv7 channels expressed in Xenopus laevis oocytes.PLoS One. 2009 Dec 11;4(12):e8251. doi: 10.1371/journal.pone.0008251. PLoS One. 2009. PMID: 20011514 Free PMC article.
-
Anxiolytic effects of Maxipost (BMS-204352) and retigabine via activation of neuronal Kv7 channels.J Pharmacol Exp Ther. 2005 Jul;314(1):282-92. doi: 10.1124/jpet.105.083923. Epub 2005 Apr 6. J Pharmacol Exp Ther. 2005. PMID: 15814569
-
Protein kinase C shifts the voltage dependence of KCNQ/M channels expressed in Xenopus oocytes.J Physiol. 2005 Nov 15;569(Pt 1):59-74. doi: 10.1113/jphysiol.2005.094995. Epub 2005 Sep 22. J Physiol. 2005. PMID: 16179364 Free PMC article.
-
Activation of Kv7 (KCNQ) voltage-gated potassium channels by synthetic compounds.Trends Pharmacol Sci. 2008 Feb;29(2):99-107. doi: 10.1016/j.tips.2007.11.010. Epub 2008 Jan 18. Trends Pharmacol Sci. 2008. PMID: 18206251 Review.
-
A structural interpretation of voltage-gated potassium channel inactivation.Prog Biophys Mol Biol. 2006 Oct;92(2):185-208. doi: 10.1016/j.pbiomolbio.2005.10.001. Epub 2005 Nov 8. Prog Biophys Mol Biol. 2006. PMID: 16316679 Review.
Cited by
-
The potassium channel subunit KV1.8 (Kcna10) is essential for the distinctive outwardly rectifying conductances of type I and II vestibular hair cells.bioRxiv [Preprint]. 2024 Aug 18:2023.11.21.563853. doi: 10.1101/2023.11.21.563853. bioRxiv. 2024. PMID: 38045305 Free PMC article. Preprint.
-
Activation of Kv7 channels normalizes hyperactivity of the VTA-NAcLat circuit and attenuates methamphetamine-induced conditioned place preference and sensitization in mice.Mol Psychiatry. 2023 Dec;28(12):5183-5194. doi: 10.1038/s41380-023-02218-5. Epub 2023 Aug 21. Mol Psychiatry. 2023. PMID: 37604975
-
ML277 regulates KCNQ1 single-channel amplitudes and kinetics, modified by voltage sensor state.J Gen Physiol. 2021 Dec 6;153(12):e202112969. doi: 10.1085/jgp.202112969. Epub 2021 Oct 12. J Gen Physiol. 2021. PMID: 34636894 Free PMC article.
-
Chemical modulation of Kv7 potassium channels.RSC Med Chem. 2021 Jan 14;12(4):483-537. doi: 10.1039/d0md00328j. eCollection 2021 Apr 28. RSC Med Chem. 2021. PMID: 34046626 Free PMC article. Review.
-
Dorsoventral differences in Kv7/M-current and its impact on resonance, temporal summation and excitability in rat hippocampal pyramidal cells.J Physiol. 2015 Apr 1;593(7):1551-80. doi: 10.1113/jphysiol.2014.280826. Epub 2015 Feb 6. J Physiol. 2015. PMID: 25656084 Free PMC article.
References
-
- Robbins, J. 2001. KCNQ potassium channels: physiology, pathophysiology, and pharmacology. Pharmacol. Ther. 90:1–19. - PubMed
-
- Jentsch, T. J. 2000. Neuronal KCNQ potassium channels: physiology and role in disease. Nat. Rev. Neurosci. 1:21–30. - PubMed
-
- Jespersen, T., M. Grunnet, and S. P. Olesen. 2005. The KCNQ1 potassium channel: from gene to physiological function. Physiology (Bethesda). 20:408–416. - PubMed
-
- Wang, Q., M. E. Curran, I. Splawski, T. C. Burn, J. M. Millholland, T. J. VanRaay, J. Shen, K. W. Timothy, G. M. Vincent, T. de Jager, P. J. Schwartz, J. A. Toubin, A. J. Moss, D. L. Atkinson, G. M. Landes, T. D. Connors, and M. T. Keating. 1996. Positional cloning of a novel potassium channel gene: KVLQT1 mutations cause cardiac arrhythmias. Nat. Genet. 12:17–23. - PubMed
-
- Sanguinetti, M. C., M. E. Curran, A. Zou, J. Shen, P. S. Spector, D. L. Atkinson, and M. T. Keating. 1996. Coassembly of K(V)LQT1 and minK (IsK) proteins to form cardiac I(Ks) potassium channel. Nature. 384:80–83. - PubMed
Publication types
MeSH terms
Substances
LinkOut - more resources
Full Text Sources


