Isoform-dependent interaction of voltage-gated sodium channels with protons
- PMID: 16873405
- PMCID: PMC1890365
- DOI: 10.1113/jphysiol.2006.115659
Isoform-dependent interaction of voltage-gated sodium channels with protons
Abstract
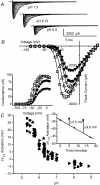
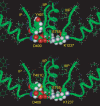
Protons are potent physiological modifiers of voltage-gated Na(+) channels, shifting the voltage range of channel gating and reducing current magnitude (pK(a) approximately 6). We recently showed that proton block of the skeletal muscle isoform (Na(V)1.4) resulted from protonation of the four superficial carboxylates in the outer vestibule of the channel. We concluded that the large local negative electrostatic field shifted the outer vestibule carboxylate pK(a) into the physiological range. However, block was not complete; the best-fit titration curves yielded an acid pH asymptote of 10-15%, suggesting that the selectivity filter carboxylates may not be protonated. Using HEK 293 cells stably expressing different isoforms, each with varying channel density, we demonstrate that a pH-independent current is found in Na(V)1.4, but not in the cardiac isoform (Na(V)1.5). Mutational studies showed that absence of the pH-independent current in Na(V)1.5 could be ascribed to the cysteine in domain I, just above the selectivity filter aspartate (Cys373). We suggest that this cysteine can be protonated in acid solution to produce a positive charge that blocks the pore. Competition between protons and Na(+) did not exist for Na(+) concentrations between 1 and 140 mm. The residual current in acid solution, when the cysteine is absent, confirms that over the range of pH values that can be achieved physiologically, the selectivity filter carboxylates are not protonated. The pH-independent current helps to protect activation of skeletal muscle during the acidosis that occurs during exercise.
Figures


Similar articles
-
Role of outer ring carboxylates of the rat skeletal muscle sodium channel pore in proton block.J Physiol. 2002 Aug 15;543(Pt 1):71-84. doi: 10.1113/jphysiol.2002.021014. J Physiol. 2002. PMID: 12181282 Free PMC article.
-
State- and use-dependent block of muscle Nav1.4 and neuronal Nav1.7 voltage-gated Na+ channel isoforms by ranolazine.Mol Pharmacol. 2008 Mar;73(3):940-8. doi: 10.1124/mol.107.041541. Epub 2007 Dec 13. Mol Pharmacol. 2008. PMID: 18079277 Free PMC article.
-
Channel activation voltage alone is directly altered in an isoform-specific manner by Na(v1.4) and Na(v1.5) cytoplasmic linkers.J Membr Biol. 2004 Feb 1;197(3):155-68. doi: 10.1007/s00232-004-0650-6. J Membr Biol. 2004. PMID: 15042347
-
pH Modulation of Voltage-Gated Sodium Channels.Handb Exp Pharmacol. 2018;246:147-160. doi: 10.1007/164_2018_99. Handb Exp Pharmacol. 2018. PMID: 29460150 Review.
-
Regulation of the voltage-gated cardiac sodium channel Nav1.5 by interacting proteins.Trends Cardiovasc Med. 2005 Jan;15(1):35-40. doi: 10.1016/j.tcm.2005.01.001. Trends Cardiovasc Med. 2005. PMID: 15795161 Review.
Cited by
-
Voltage-gated sodium channels in cancers.Biomark Res. 2024 Jul 25;12(1):70. doi: 10.1186/s40364-024-00620-x. Biomark Res. 2024. PMID: 39060933 Free PMC article. Review.
-
Ion channel selectivity through ion-modulated changes of selectivity filter pKa values.Proc Natl Acad Sci U S A. 2023 Jun 27;120(26):e2220343120. doi: 10.1073/pnas.2220343120. Epub 2023 Jun 20. Proc Natl Acad Sci U S A. 2023. PMID: 37339196 Free PMC article.
-
Sodium channels and the ionic microenvironment of breast tumours.J Physiol. 2023 May;601(9):1543-1553. doi: 10.1113/JP282306. Epub 2022 Oct 21. J Physiol. 2023. PMID: 36183245 Free PMC article.
-
Frequency-Dependent Action of Neuromodulation.eNeuro. 2021 Nov 9;8(6):ENEURO.0338-21.2021. doi: 10.1523/ENEURO.0338-21.2021. Print 2021 Nov-Dec. eNeuro. 2021. PMID: 34593519 Free PMC article.
-
Cationic Modulation of Voltage-Gated Sodium Channel (Nav1.5): Neonatal Versus Adult Splice Variants-2. Divalent (Cd2+) and Trivalent (Gd3+) Ions.Bioelectricity. 2019 Sep 1;1(3):148-157. doi: 10.1089/bioe.2019.0014. Epub 2019 Sep 16. Bioelectricity. 2019. PMID: 34471817 Free PMC article.
References
-
- Backx PH, Yue DT, Lawrence JH, Marban E, Tomaselli GF. Molecular localization of an ion-binding site within the pore of mammalian sodium channels. Science. 1992;257:248–251. - PubMed
-
- Benitah J, Balser JR, Marban E, Tomaselli GF. Proton inhibition of sodium channels: mechanism of gating shifts and reduced conductance. J Membr Biol. 1997;155:121–131. - PubMed
-
- Chang NS, French RJ, Lipkind GM, Fozzard HA, Dudley S., Jr Predominant interactions between μ-conotoxin Arg-13 and the skeletal muscle Na+ channel localized by mutant cycle analysis. Biochemistry. 1998;37:4407–4419. - PubMed
-
- Chiamvimonvat N, Perez-Garcia MT, Ranjan R, Marban E, Tomaselli GF. Depth asymmetries of the pore-lining segments of the Na+ channel revealed by cysteine mutagenesis. Neuron. 1996a;16:1037–1047. - PubMed
Publication types
MeSH terms
Substances
Grants and funding
LinkOut - more resources
Full Text Sources
Miscellaneous


